Wires and Cables Market Report by Voltage (Low Voltage, Medium and High Voltage, Extra High Voltage), Installation (Overhead, Underground), End User (Building and Construction, Aerospace and Defense, Oil and Gas, IT and Telecommunication, Energy and Power, and Others), and Region 2025-2033
Wires and Cables Market Size:
The global wires and cables market size reached USD 227.8 Billion in 2024. Looking forward, IMARC Group expects the market to reach USD 381.2 Billion by 2033, exhibiting a growth rate (CAGR) of 5.88% during 2025-2033. Rapid urbanization and industrialization, expansion of renewable energy projects, the adoption of electric vehicles (EVs), technological advancements, the rise of smart grid systems, the proliferation of data centers, and government initiatives for infrastructure modernization and investments in smart city projects are fueling the market growth.
|
Report Attribute
|
Key Statistics
|
|---|---|
|
Base Year
|
2024 |
|
Forecast Years
|
2025-2033
|
|
Historical Years
|
2019-2024
|
| Market Size in 2024 | USD 227.8 Billion |
| Market Forecast in 2033 | USD 381.2 Billion |
| Market Growth Rate 2025-2033 | 5.88% |
Wires and Cables Market Analysis:
- Major Market Drivers: The factors driving the global wires and cables market growth include the vast expansion of renewable energy globally, which requires the use of vast quantities of cabling for solar panels and wind turbines. Another factor is rapid urbanization across developing economies, which has greatly increased the need for electricity grids into new urban centers. The expansion of telecom infrastructure across the globe, geared towards fifth generation (5G) network is stimulating the market growth. The global automotive industry’s transition to electric vehicles (EVs) that will require more specialized forms of automotive cabling, which is further driving the wires and cables market share. The increasing investment in smart grids and smart homes will entail the use of advanced new types of cabling systems that transmit both data and electricity, which is further accelerating the market growth.
- Key Market Trends: Several wires and cables market trends define the business dynamics in the market, which includes the shifting preference of the manufacturing companies toward halogen-free and eco-friendly materials to comply with environmental regulations. In line with this, the Internet of Things (IoT) technology is increasingly being integrated into cable systems, enabling real-time checking of the wires and the network’s effectiveness to ensure reliability, which is further boosting the market growth. Furthermore, many manufacturers are heavily investing in high voltage direct current cables to provide low energy loss during lengthy or submarine long-distance power transmission, which is further driving the wires and cables demand.
- Geographical Trends: At present, the global wires and cables market is led by the Asia-Pacific region that is represented by such populous countries as China and India, with rapid urbanization processes, industrialization, and a growing demand for infrastructure. Both countries make extensive infrastructure investments in power, technology, energy, and other sectors that call for sophisticated cable networks. As per the wires and cables market analysis, the markets of Europe and North America, where the industry is influenced by the increasing share of renewable energy and the replacement of outdated electrical systems, play a significant role in market development.
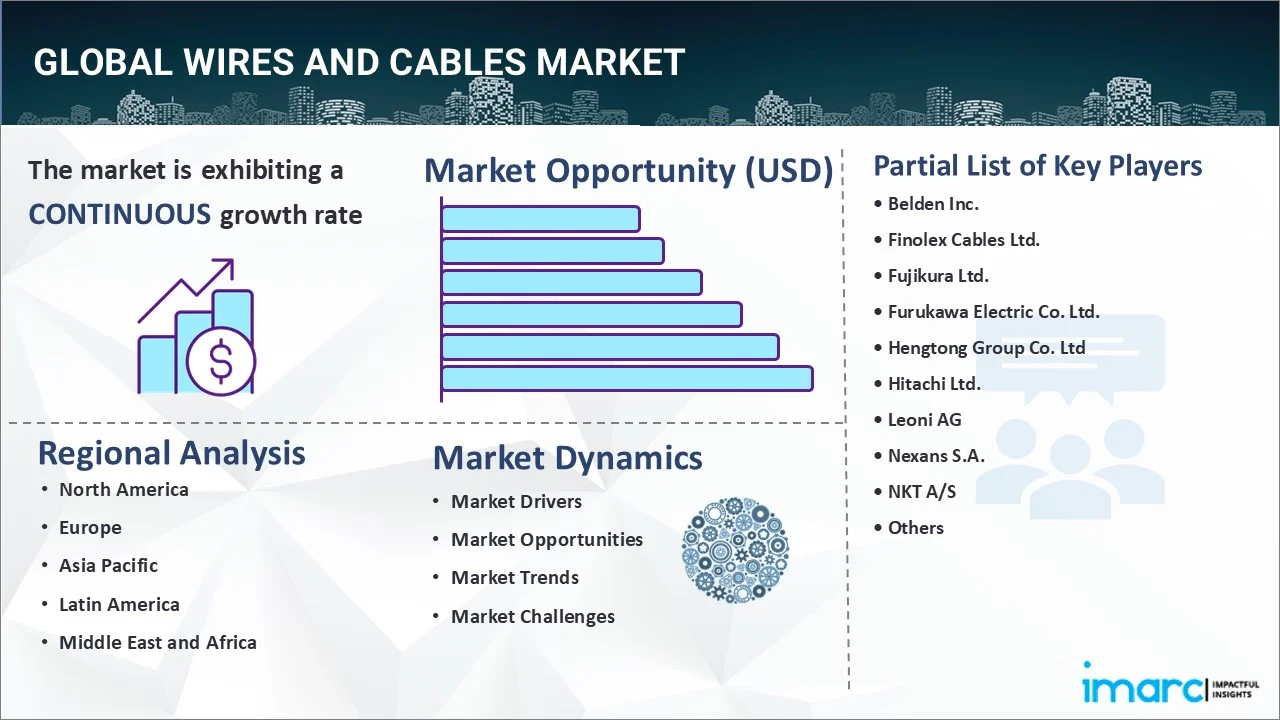
- Competitive Landscape: As per the market statistics, some of the key wires and cables companies include Belden Inc., Finolex Cables Ltd., Fujikura Ltd., Furukawa Electric Co. Ltd., Hengtong Group Co. Ltd, Hitachi Ltd., Leoni AG, Nexans S.A., NKT A/S, Polycab India Limited, Prysmian Group, Southwire Company LLC, Sumitomo Electric Industries Ltd., etc.
- Challenges and Opportunities: As per the wires and cables market report, the competitive landscape in the market is marked by a mix of large multinational corporations and regional players. Key players are dominating the market through technological innovation, strategic mergers and acquisitions, and expansive distribution networks. Major companies are focusing on developing more efficient, durable, and less environmentally damaging cable solutions to stay ahead. Competition is also driven by new entrants introducing disruptive technologies, particularly in the renewable energy sector and smart technology integration, which is further stimulating the wires and cables market outlook.

Wires and Cables Market Trends:
Urbanization and Industrialization
Rapid urbanization and industrialization in emerging economies are key drivers of the global wires and cables market. According to the GlobalData, India registered 1.34% urbanization rate in 2021, reflecting a 1.5% year-on-year increase. Moreover, increased migration of people to cities and towns and expansion of various industrial sectors increases the need for infrastructure development. This encompasses residential and commercial buildings, manufacturing plants and factories, and transportation. Wires and cables are crucial for electrical power distribution, communication systems, and data transmission channels. Cables are essential in the construction of new buildings and modification of existing structures. The development of new roads and railways require intensive cabling to supply power to lighting and heating, ventilation, and air conditioning (HVAC) systems.
Expansion of Renewable Energy Projects
Globally, the demand for wires and cables is driven by the growth of renewable energy projects such as wind and solar farms. The US Department of Energy reported that renewable energy provided over 20% of all electricity generation in the country. Furthermore, the percentage continues to increase given the political and business efforts to lower carbon emissions and switch to green sources, creating new power transmission infrastructure. In separated systems, wires and cables link the renewable source directly to the substation and support power redistribution over long distances.
Adoption of Electric Vehicles (EVs)
The increasing use of EVs is driving wires and cables market expansion to meet the growing need for charging infrastructure. Governments all over the world are implementing measures to reduce the economy’s reliance on fossil fuels, further reducing one of the most important sources of pollution. Moreover, the automotive industry is in the midst of transitioning to electric mobility, where wires and cables play a significant role in EV charging infrastructure, connecting charging slots to the power grid and allowing electricity to flow downward to electric vehicles. As even newer electronic vehicles become more widely used and more charging stations are constructed, the demand for quality cables that can handle high power and facilitate high amp charging technology has increased as well.
Wires and Cables Industry Segmentation:
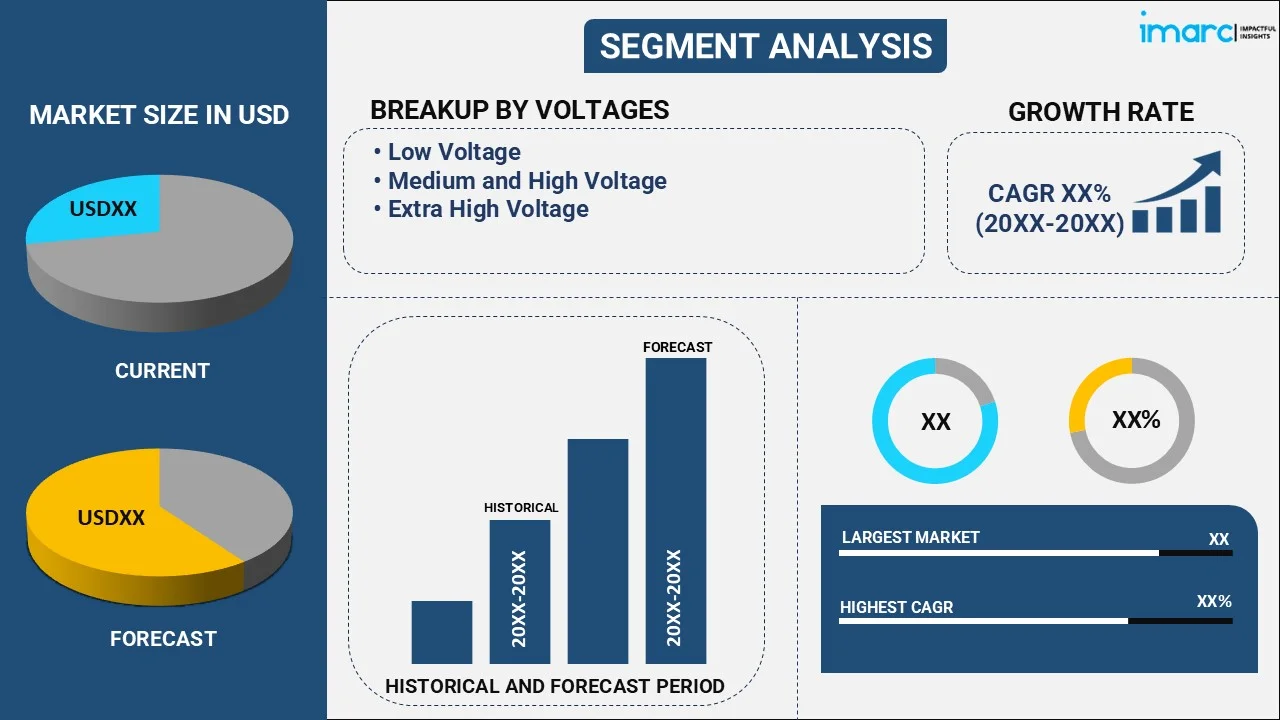
IMARC Group provides an analysis of the key trends in each segment of the market, along with forecasts at the global, regional, and country levels for 2025-2033. Our report has categorized the market based on the voltage, installation, and end user.
Breakup by Voltage:

- Low Voltage
- Medium and High Voltage
- Extra High Voltage
Low voltage accounts for the majority of the market share
The report has provided a detailed breakup and analysis of the market based on the voltage. This includes low voltage, medium and high voltage and extra high voltage. According to the report, low voltage represented the largest segment.
The low voltage segment is driven by the increasing demand for electricity in residential, commercial, and industrial applications. In residential settings, the rising global population coupled with urbanization drives the need for housing, resulting in increased construction activities and subsequently, the demand for low voltage wires and cables for lighting, appliances, and electrical outlets. Furthermore, the growing trend towards smart homes, characterized by automated systems for lighting, heating, and security, necessitates the deployment of low voltage cables to support these advanced technologies, further propelling market growth. Additionally, in commercial environments, the proliferation of office buildings, shopping malls, and other commercial complexes drives the demand for low voltage wiring solutions to power lighting, HVAC systems, computers, and other electronic devices, as well as for data transmission in networking applications.
Breakup by Installation:
- Overhead
- Underground
Overhead installation accounts for the majority of the market share
The report has provided a detailed breakup and analysis of the market based on the installation. This includes overhead and underground. According to the report, overhead installation represented the largest segment.
The overhead installation segment is driven by the increasing demand for cost-effective and easily deployable solutions in various applications. Overhead installations offer significant cost savings compared to underground or underwater installations due to reduced labor and material costs associated with trenching or burial. Additionally, the overhead segment benefits from its versatility and adaptability to diverse terrain and environmental conditions, making it ideal for rural electrification projects and infrastructure development in remote areas where underground installations may be impractical or prohibitively expensive. Moreover, the overhead segment is driven by the growing emphasis on renewable energy integration, particularly in wind and solar power projects, where overhead transmission lines provide a cost-effective means of transporting electricity from remote generation sites to urban centers or industrial facilities.
Breakup by End User:
- Building and Construction
- Aerospace and Defense
- Oil and Gas
- IT and Telecommunication
- Energy and Power
- Others
Energy and power accounts for the majority of the market share
The report has provided a detailed breakup and analysis of the market based on the end user. This includes building and construction, aerospace and defense, oil and gas, it and telecommunication, energy and power, and others. According to the report, energy and power represented the largest segment.
The energy and power segment is driven by the increasing global demand for electricity, primarily fueled by population growth, urbanization, and industrialization. As populations expand and economies develop, there is a growing need for reliable and affordable energy sources to power homes, businesses, and industries. This demand is further amplified by the rising adoption of electric vehicles (EVs) and the electrification of various sectors, including transportation and heating. Additionally, the segment is propelled by the increasing emphasis on renewable energy sources, such as wind, solar, and hydroelectric power, driven by environmental concerns and government incentives to reduce carbon emissions and combat climate change. Investments in renewable energy infrastructure, including power plants, wind farms, and solar installations, continue to surge as countries strive to meet their renewable energy targets and transition away from fossil fuels.
Breakup by Region:

- North America
- United States
- Canada
- Europe
- Germany
- France
- United Kingdom
- Italy
- Spain
- Others
- Asia Pacific
- China
- Japan
- India
- South Korea
- Australia
- Indonesia
- Others
- Latin America
- Brazil
- Mexico
- Others
- Middle East and Africa
Asia Pacific leads the market, accounting for the largest wires and cables market share
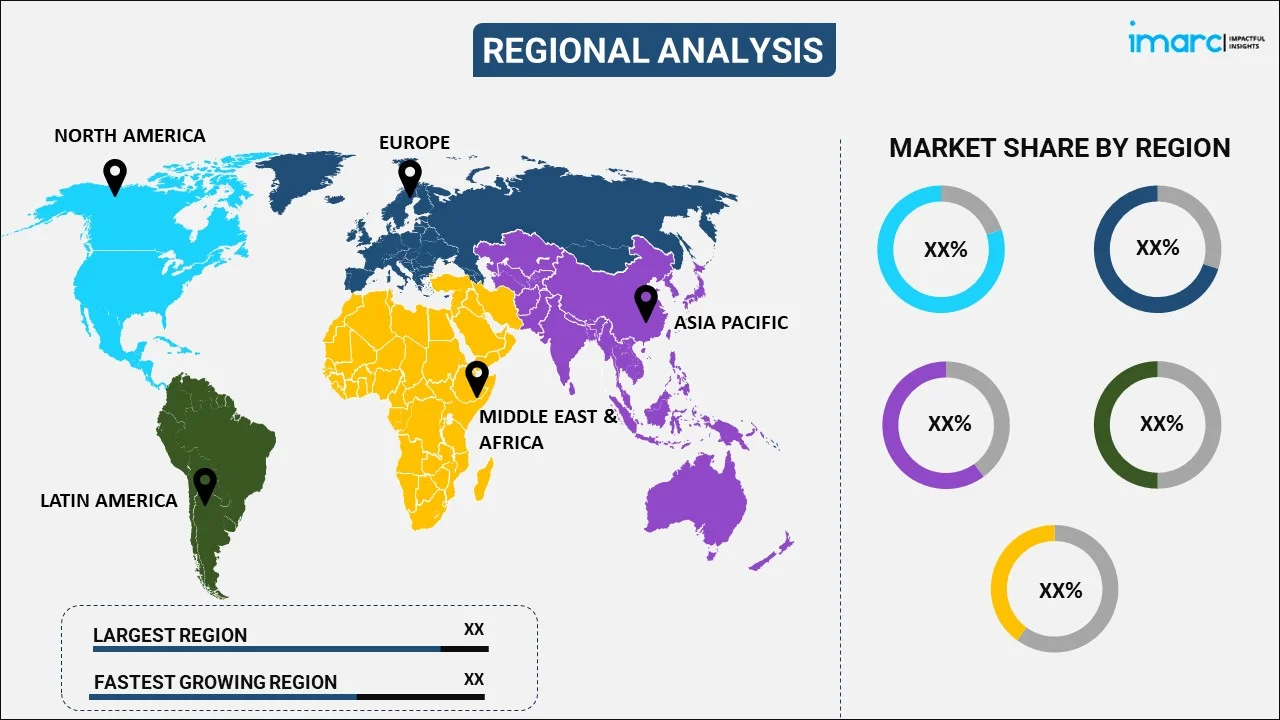
The report has also provided a comprehensive analysis of all the major regional markets, which include North America (the United States and Canada); Europe (Germany, France, the United Kingdom, Italy, Spain, and others); Asia Pacific (China, Japan, India, South Korea, Australia, Indonesia, and others); Latin America (Brazil, Mexico, and others); and the Middle East and Africa. According to the report, Asia Pacific represents the largest regional market for wires and cables.
The Asia Pacific region is driven by the increasing urbanization and industrialization, which fuel the demand for wires and cables in infrastructure development and industrial projects. As countries like China and India undergo rapid urban expansion and industrial growth, there is a substantial need for reliable electrical systems to power buildings, transportation networks, and manufacturing facilities. This necessitates extensive deployment of wires and cables for electrical distribution, lighting, HVAC systems, and communication infrastructure. Additionally, the region is witnessing a surge in renewable energy projects, such as solar and wind farms, driven by government initiatives to reduce carbon emissions and achieve energy security. The transition towards cleaner energy sources requires significant investments in power transmission and distribution infrastructure, thereby driving the demand for specialized cables capable of transmitting renewable energy over long distances efficiently. Moreover, the adoption of electric vehicles (EVs) is on the rise across the Asia Pacific, supported by government incentives and growing environmental awareness.
Competitive Landscape:
- The market research report has also provided a comprehensive analysis of the competitive landscape in the market. Detailed profiles of all major companies have also been provided. Some of the major market players in the wires and cables industry include Belden Inc., Finolex Cables Ltd., Fujikura Ltd., Furukawa Electric Co. Ltd., Hengtong Group Co. Ltd, Hitachi Ltd., Leoni AG, Nexans S.A., NKT A/S, Polycab India Limited, Prysmian Group, Southwire Company LLC, Sumitomo Electric Industries Ltd., etc.
(Please note that this is only a partial list of the key players, and the complete list is provided in the report.)
- Key players in the wires and cables market are engaging in various strategies to maintain and enhance their market positions. One prominent approach involves investing heavily in research and development (R&D) to innovate new products and technologies that meet evolving customer needs and regulatory requirements. These innovations may include the development of cables with improved performance characteristics, such as higher conductivity, greater durability, and enhanced fire resistance. Additionally, players are focusing on expanding their geographical presence through strategic partnerships, acquisitions, and joint ventures to access new markets and tap into emerging opportunities. Furthermore, there is a growing emphasis on sustainability, with companies investing in eco-friendly materials and manufacturing processes to reduce their environmental footprint and appeal to environmentally conscious consumers. Moreover, players are actively pursuing vertical integration strategies to strengthen their supply chains and control costs by manufacturing key components in-house. This vertical integration enables companies to ensure the quality and reliability of their products while also enhancing their competitiveness in the market.
Wires and Cables Market News:
- In 2021: Fujikura and US Conec have reached an agreement for licensing and collaboration that enables both companies to manufacture intermateable multi-fiber and duplex VSFF (Very Small Form Factor) connectors. The MMC, a multi-fiber connector employing a reduced-size 1x16-fiber MT-style ferrule (TMT), improves MPO port density by a factor of three, supporting higher density cabling infrastructure with very low insertion loss performance.
- In 2021: Nexans opened a cable harness production facility in the city of Tianjin, China. Covering a 3,000m² area, the facility will be used to produce a wide range of wind cable products and solutions.
Wires and Cables Market Report Scope:
| Report Features | Details |
|---|---|
| Base Year of the Analysis | 2024 |
| Historical Period | 2019-2024 |
| Forecast Period | 2025-2033 |
| Units | Billion USD |
| Scope of the Report | Exploration of Historical Trends and Market Outlook, Industry Catalysts and Challenges, Segment-Wise Historical and Future Market Assessment:
|
| Voltages Covered | Low Voltage, Medium and High Voltage, Extra High Voltage |
| Installations Covered | Overhead, Underground |
| End Users Covered | Building and Construction, Aerospace and Defense, Oil and Gas, IT and Telecommunication, Energy and Power, Others |
| Regions Covered | Asia Pacific, Europe, North America, Latin America, Middle East and Africa |
| Countries Covered | United States, Canada, Germany, France, United Kingdom, Italy, Spain, China, Japan, India, South Korea, Australia, Indonesia, Brazil, Mexico |
| Companies Covered | Belden Inc., Finolex Cables Ltd., Fujikura Ltd., Furukawa Electric Co. Ltd., Hengtong Group Co. Ltd, Hitachi Ltd., Leoni AG, Nexans S.A., NKT A/S, Polycab India Limited, Prysmian Group, Southwire Company LLC, Sumitomo Electric Industries Ltd., etc. |
| Customization Scope | 10% Free Customization |
| Post-Sale Analyst Support | 10-12 Weeks |
| Delivery Format | PDF and Excel through Email (We can also provide the editable version of the report in PPT/Word format on special request) |
Key Benefits for Stakeholders:
- IMARC’s industry report offers a comprehensive quantitative analysis of various market segments, historical and current market trends, market forecasts, and dynamics of the wires and cables market from 2019-2033.
- The research report provides the latest information on the market drivers, challenges, and opportunities in the global wires and cables market.
- The study maps the leading, as well as the fastest-growing, regional markets. It further enables stakeholders to identify the key country-level markets within each region.
- Porter's five forces analysis assists stakeholders in assessing the impact of new entrants, competitive rivalry, supplier power, buyer power, and the threat of substitution. It helps stakeholders to analyze the level of competition within the wires and cables industry and its attractiveness.
- The competitive landscape allows stakeholders to understand their competitive environment and provides insight into the current positions of key players in the market.
Key Questions Answered in This Report
The wires and cables market was valued at USD 227.8 Billion in 2024.
The wires and cables market is projected to exhibit a (CAGR) of 5.88% during 2025-2033, reaching a value of USD 381.2 Billion by 2033.
The wires and cables industry is fueled by fast-paced urbanization, increasing infrastructure development, and growing demand for electricity and telecommunication. Increased growth in renewable power projects, industrial automation, and electric vehicle adoption also increases market growth. Improvements in materials and safety regulations further improve the performance of products and drive extensive use across industries.
Asia Pacific currently dominates the wires and cables market in view of enormous investments in smart grid infrastructure, intensive large-scale construction processes, and increasing industrialization. China, India, and Japan are leading the upgrade in power transmission, renewable energy integration, and digital connectivity, and thus the region is a central location for market growth.
Some of the major players in the wires and cables market include Belden Inc., Finolex Cables Ltd., Fujikura Ltd., Furukawa Electric Co. Ltd., Hengtong Group Co. Ltd, Hitachi Ltd., Leoni AG, Nexans S.A., NKT A/S, Polycab India Limited, Prysmian Group, Southwire Company LLC, Sumitomo Electric Industries Ltd., etc.
Need more help?
- Speak to our experienced analysts for insights on the current market scenarios.
- Include additional segments and countries to customize the report as per your requirement.
- Gain an unparalleled competitive advantage in your domain by understanding how to utilize the report and positively impacting your operations and revenue.
- For further assistance, please connect with our analysts.
 Request Customization
 Speak to an Analyst
 Request Brochure
 Inquire Before Buying


.webp)


.webp)


