
Vitamin C Prices, Trend, Chart, Demand, Market Analysis, News, Historical and Forecast Data Report 2026 Edition
Vitamin C Price Trend, Index and Forecast
Track the latest insights on vitamin c price trend and forecast with detailed analysis of regional fluctuations and market dynamics across North America, Latin America, Central Europe, Western Europe, Eastern Europe, Middle East, North Africa, West Africa, Central and Southern Africa, Central Asia, Southeast Asia, South Asia, East Asia, and Oceania.
Vitamin C Prices Outlook Q2 2026
- USA: USD 2556/MT
- China: USD 2412/MT
- India: USD 2539/MT
- Japan: USD 2428/MT
- Canada: USD 2530/MT
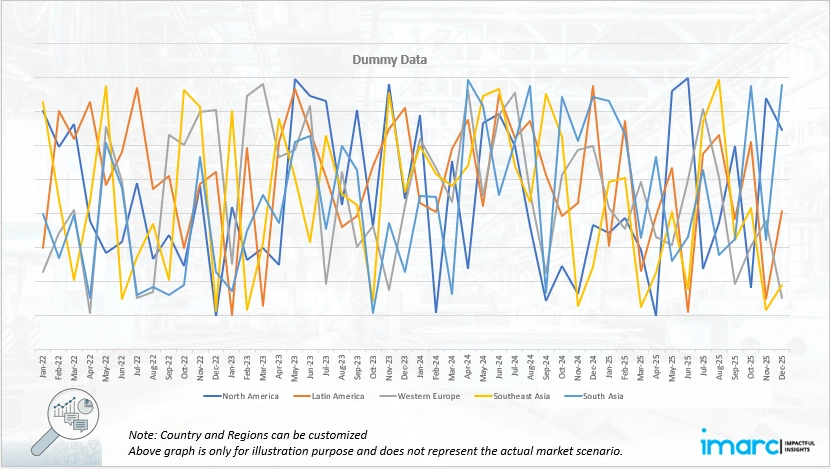
Vitamin C Price Chart
Get real-time access to monthly/quarterly/yearly prices Request Sample
During the second quarter of 2026, the vitamin C prices in the USA reached 2556 USD/MT in June. Prices advanced sharply, driven by tightening domestic supply and robust procurement from downstream pharmaceutical and nutraceutical manufacturers. Active demand from the dietary supplement and functional food sectors absorbed available material and reduced spot market flexibility. Higher production and logistics costs at domestic chemical facilities contributed to firmer producer offers throughout the period.
During the second quarter of 2026, the Vitamin C prices in China reached 2412 USD/MT in June. Prices rose supported by recovering downstream demand and disciplined operating rates at major ascorbic acid production facilities. Domestic manufacturers maintained tight inventory positions, which limited surplus accumulation at key trading hubs and supported firmer offers. Export enquiries from European and North American buyers remained active, absorbing a significant share of available output.
During the second quarter of 2026, the Vitamin C prices in India reached 2539 USD/MT in June. Prices recorded a sharp increase, making India one of the fastest-rising markets among the five countries tracked. Strong domestic demand from the pharmaceutical formulations, nutraceutical, and food fortification industries absorbed available supply and kept inventories tight throughout the period.
During the second quarter of 2026, the Vitamin C prices in Japan reached 2428 USD/MT in June. Prices increased, driven by higher import replacement costs and elevated freight and insurance expenses that raised the landed cost of procured material. Japanese buyers, who rely substantially on imported ascorbic acid and Vitamin C derivatives, faced firmer offers as exporters in key supplying countries maintained tight availability. Demand from pharmaceutical manufacturers, food and beverage producers, and cosmetic formulators provided a stable consumption base throughout the quarter.
During the second quarter of 2026, the Vitamin C prices in Canada reached 2530 USD/MT in June. Prices rose tracking the broader upward direction seen across North America. Strong United States demand absorbed a significant share of regionally available supply, reducing cross-border spot flexibility for Canadian buyers. Importers faced firmer replacement costs as international supplier offers remained elevated against a backdrop of recovering downstream demand from the nutraceutical, pharmaceutical, and functional food sectors.
Regional Coverage
The report provides a detailed analysis of the market across different regions, each with unique pricing dynamics influenced by localized market conditions, supply chain intricacies, and geopolitical factors. This includes price trends, price forecast and supply and demand trends for each region, along with spot prices by major ports. The report also provides coverage of FOB and CIF prices, as well as the key factors influencing vitamin c prices.
Europe Vitamin C Price Trend
Q2 2026:
The Vitamin C price index in Europe moved upward during the second quarter of 2026, supported by tighter import availability, firmer offers from key Asian suppliers, and steady downstream demand across the region. European buyers, who depend significantly on imported ascorbic acid from Chinese and Indian producers, faced higher replacement costs as export prices in source markets remained elevated throughout the period. Demand from the pharmaceutical, dietary supplement, food fortification, and cosmetic industries provided consistent offtake support and limited the accumulation of surplus inventory at regional distribution points. Logistics disruptions and port congestion at key European terminals periodically restricted the timely movement of imported cargoes, raising replacement uncertainty and encouraging forward buying among procurement teams. Energy costs at European blending and formulation facilities remained elevated, adding further pressure to overall production economics and supporting firmer delivered prices across multiple end-use sectors.
This analysis can be extended to include detailed vitamin C price information for a comprehensive list of countries.
| Region | Countries Covered |
|---|---|
| Europe | Germany, France, United Kingdom, Italy, Spain, Russia, Turkey, Netherlands, Poland, Sweden, Belgium, Austria, Ireland, Switzerland, Norway, Denmark, Romania, Finland, Czech Republic, Portugal, and Greece, among other European countries. |
North America Vitamin C Price Trend
Q2 2026:
The Vitamin C price index in North America rose strongly during the second quarter of 2026, driven by constrained import availability, active downstream procurement, and firmer offers from major Asian suppliers. United States buyers faced elevated replacement costs as global Vitamin C supply tightened and export availability from key producing countries remained disciplined. Demand from pharmaceutical manufacturers, nutraceutical producers, dietary supplement formulators, and functional food and beverage companies supported consistent procurement volumes throughout the period. Canadian buyers experienced additional pressure as strong United States demand absorbed a large share of regionally available material, reducing cross-border spot flexibility and pushing replacement costs higher. Freight and logistics costs remained elevated, contributing to the firm pricing environment for imported cargoes entering major North American ports.
Specific vitamin C historical data within the United States and Canada can also be provided.
| Region | Countries Covered |
|---|---|
| North America | United States and Canada |
Middle East and Africa Vitamin C Price Trend
Q2 2026:
The study includes Vitamin C price trends across the Middle East and Africa, taking into consideration variables that have a direct impact on market prices, such as regional industrial expansion, natural resource availability, and geopolitical conflicts.
In addition to region-wise data, information on vitamin C prices for countries can also be provided.
| Region | Countries Covered |
|---|---|
| Middle East & Africa | Saudi Arabia, UAE, Israel, Iran, South Africa, Nigeria, Oman, Kuwait, Qatar, Iraq, Egypt, Algeria, and Morocco, among other Middle Eastern and African countries. |
Asia Pacific Vitamin C Price Trend
Q2 2026:
Vitamin C prices in Asia Pacific moved upward during the second quarter of 2026 as disciplined production, firm export demand, and steady downstream consumption tightened market balances across the region. China, as the dominant global producer of ascorbic acid and Vitamin C derivatives, maintained controlled operating rates at key manufacturing facilities, which limited surplus accumulation and supported firmer domestic and export offer levels throughout the quarter. Japan faced elevated import replacement costs and freight uncertainty, with buyers maintaining regular procurement schedules to ensure continuity of supply for pharmaceutical, cosmetic, and functional food applications. Demand from the health supplement, fortified beverage, pharmaceutical formulation, and personal care sectors provided a stable and recurring consumption base across multiple Asia Pacific markets. Logistics conditions remained broadly manageable for much of the period, though periodic congestion at major regional ports affected cargo scheduling and encouraged some buyers to secure forward volumes ahead of anticipated price increases.
This vitamin C price analysis can be expanded to include a comprehensive list of countries within the region.
| Region | Countries Covered |
|---|---|
| Asia Pacific | China, India, Indonesia, Pakistan, Bangladesh, Japan, Philippines, Vietnam, Thailand, South Korea, Malaysia, Nepal, Taiwan, Sri Lanka, Hongkong, Singapore, Australia, and New Zealand, among other Asian countries. |
Latin America Vitamin C Price Trend
Q2 2026:
The Vitamin C market in Latin America is primarily driven by the region's abundant natural resources, particularly in Chile and Brazil. However, due to political instability and varying regulatory regimes, Vitamin C prices might fluctuate dramatically.
This comprehensive review can be extended to include specific countries within the region.
| Region | Countries Covered |
|---|---|
| Latin America | Brazil, Mexico, Argentina, Columbia, Chile, Ecuador, and Peru, among other Latin American countries. |
Vitamin C Pricing Report, Market Analysis, and News
IMARC's latest publication, "Vitamin C Prices, Trend, Chart, Demand, Market Analysis, News, Historical and Forecast Data Report 2026 Edition," presents a detailed examination of the vitamin c market, providing insights into both global and regional trends that are shaping prices. This report delves into the spot price of vitamin c at major ports and analyzes the composition of prices, including FOB and CIF terms. It also presents detailed vitamin c prices trend analysis by region, covering North America, Europe, Asia Pacific, Latin America, and Middle East and Africa. The factors affecting vitamin c pricing, such as the dynamics of supply and demand, geopolitical influences, and sector specific developments, are thoroughly explored. This comprehensive report helps stakeholders stay informed with the latest market news, regulatory updates, and technological progress, facilitating informed strategic decision-making and forecasting.
Vitamin C Industry Analysis
The global vitamin C market size reached USD 2.1 Billion in 2025. By 2034, IMARC Group expects the market to reach USD 3.5 Billion, at a projected CAGR of 5.64% during 2026-2034. Market growth is being driven by the rising consumer demand for immune-support dietary supplements and fortified functional foods that contain ascorbic acid as a key active ingredient, the expanding use of Vitamin C in pharmaceutical formulations and nutraceutical products across, and the growing adoption of Vitamin C as an antioxidant and preservative in the food processing, cosmetic, and personal care industries.
Latest News and Developments:
- September 2026: Vitamin C was linked to improved outcomes in people with precancerous conditions, with research showing it boosts TET enzyme activity to help regulate gene expression at the cellular level, highlighting its expanding role in health science.
- March 2024: DSM-Firmenich officially announced the completion and sale of its entire equity stake in DSM Jiangshan Pharmaceutical CO., Ltd to JingJiang Cosfocus Health Technology Co., Ltd.
Product Description
Vitamin C, chemically known as ascorbic acid, is a water-soluble essential nutrient and one of the most widely consumed vitamins in the world, recognized for its critical roles in human health and its broad utility across multiple industries. It exists as a white to pale yellow crystalline solid and is characterized by strong antioxidant activity, high water solubility, and the ability to donate electrons to free radicals and reactive oxygen species, thereby protecting cells and tissues from oxidative damage. Vitamin C is biosynthesized in most plants and animals but must be obtained through dietary sources or supplementation in humans, as the human body lacks the enzyme required for its internal synthesis. Industrially, it is produced primarily through the Reichstein process or modern two-step fermentation routes using glucose as the starting material, followed by purification and crystallization to yield pharmaceutical and food-grade ascorbic acid. In the pharmaceutical industry, it is used extensively in oral and injectable formulations targeting immune support, wound healing, and antioxidant therapy.
Report Coverage
| Key Attributes | Details |
|---|---|
| Product Name | Vitamin C |
| Report Features | Exploration of Historical Trends and Market Outlook, Industry Demand, Industry Supply, Gap Analysis, Challenges, Vitamin C Price Analysis, and Segment-Wise Assessment. |
| Currency/Units | US$ (Data can also be provided in local currency) or Metric Tons |
| Region/Countries Covered | The current coverage includes analysis at the global and regional levels only. Based on your requirements, we can also customize the report and provide specific information for the following countries: Asia Pacific: China, India, Indonesia, Pakistan, Bangladesh, Japan, Philippines, Vietnam, Thailand, South Korea, Malaysia, Nepal, Taiwan, Sri Lanka, Hongkong, Singapore, Australia, and New Zealand Europe: Germany, France, United Kingdom, Italy, Spain, Russia, Turkey, Netherlands, Poland, Sweden, Belgium, Austria, Ireland, Switzerland, Norway, Denmark, Romania, Finland, Czech Republic, Portugal and Greece North America: United States and Canada Latin America: Brazil, Mexico, Argentina, Columbia, Chile, Ecuador, and Peru Middle East & Africa: Saudi Arabia, UAE, Israel, Iran, South Africa, Nigeria, Oman, Kuwait, Qatar, Iraq, Egypt, Algeria, and Morocco The list of countries presented is not exhaustive. Information on additional countries can be provided if required by the client. |
| Information Covered for Key Suppliers |
|
| Customization Scope | The report can be customized as per the requirements of the customer |
| Report Price and Purchase Option |
Plan A: Monthly Updates - Annual Subscription
Plan B: Quarterly Updates - Annual Subscription
Plan C: Biannually Updates - Annual Subscription
|
| Post-Sale Analyst Support | 360-degree analyst support after report delivery |
| Delivery Format | PDF and Excel through email (We can also provide the editable version of the report in PPT/Word format on special request) |
Key Benefits for Stakeholders:
- IMARC’s report presents a detailed analysis of vitamin c pricing, covering global and regional trends, spot prices at key ports, and a breakdown of Ex Works, FOB, and CIF prices.
- The study examines factors affecting vitamin c price trend, including raw material costs, supply-demand shifts, geopolitical impacts, and industry developments, offering insights for informed decision-making.
- The competitive landscape review equips stakeholders with crucial insights into the latest market news, regulatory changes, and technological advancements, ensuring a well-rounded, strategic overview for forecasting and planning.
- IMARC offers various subscription options, including monthly, quarterly, and biannual updates, allowing clients to stay informed with the latest market trends, ongoing developments, and comprehensive market insights. The vitamin c price charts ensure our clients remain at the forefront of the industry.
Need more help?
- Speak to our experienced analysts for insights on the current market scenarios.
- Include additional segments and countries to customize the report as per your requirement.
- Gain an unparalleled competitive advantage in your domain by understanding how to utilize the report and positively impacting your operations and revenue.
- For further assistance, please connect with our analysts.
 Request Customization
 Inquire Before Buying
 Speak to an Analyst
 Request Brochure
Benefits of Customization
- Personalize this research
- Triangulate with your data
- Get data as per your format and definition
- Gain a deeper dive into a specific application, geography, customer, or competitor
- Any level of personalization
Get in Touch With Us
UNITED STATES
Phone: +1-201-971-6302
INDIA
Phone: +91-120-433-0800
UNITED KINGDOM
Phone: +44-753-714-6104
Email: [email protected]
Client Testimonials




.webp)




.webp)













Related Reports

Why Choose Us
IMARC offers trustworthy, data-centric insights into commodity pricing and evolving market trends, enabling businesses to make well-informed decisions in areas such as procurement, strategic planning, and investments. With in-depth knowledge spanning more than 1000 commodities and a vast global presence in over 150 countries, we provide tailored, actionable intelligence designed to meet the specific needs of diverse industries and markets.
1000
+Commodities
150
+Countries Covered
3000
+Clients
20
+Industry

Robust Methodologies & Extensive Resources
IMARC delivers precise commodity pricing insights using proven methodologies and a wealth of data to support strategic decision-making.

Subscription-Based Databases
Our extensive databases provide detailed commodity pricing, import-export trade statistics, and shipment-level tracking for comprehensive market analysis.

Primary Research-Driven Insights
Through direct supplier surveys and expert interviews, we gather real-time market data to enhance pricing accuracy and trend forecasting.

Extensive Secondary Research
We analyze industry reports, trade publications, and market studies to offer tailored intelligence and actionable commodity market insights.
Trusted by 3000+ industry leaders worldwide to drive data-backed decisions. From global manufacturers to government agencies, our clients rely on us for accurate pricing, deep market intelligence, and forward-looking insights.