
Visual Analytics Market Size, Share, Trends and Forecast by Component, Service, Deployment Mode, Enterprise Size, Business Function, Industry Vertical, and Region, 2025-2033
Visual Analytics Market Size and Share:
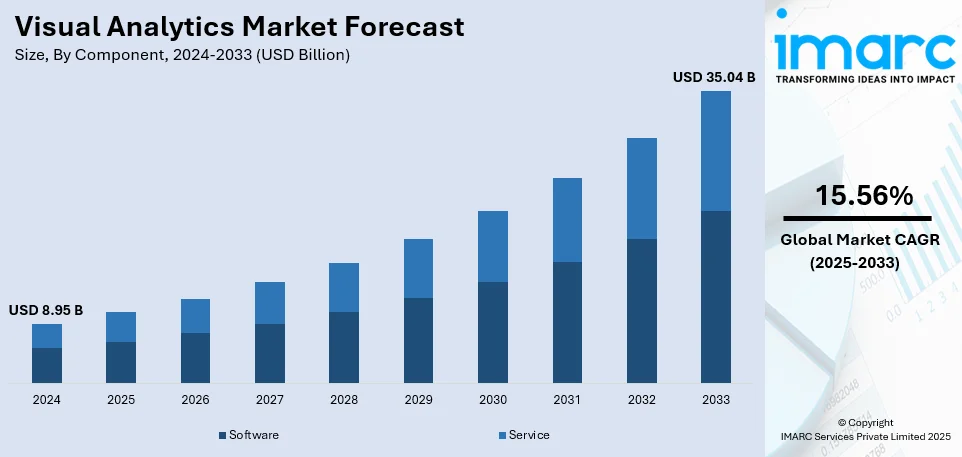
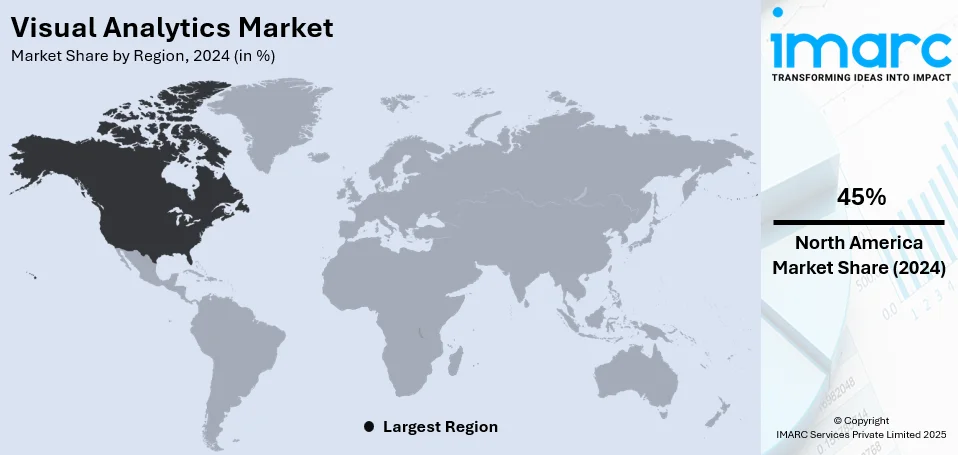
The global visual analytics market size was valued at USD 8.95 Billion in 2024. Looking forward, IMARC Group estimates the market to reach USD 35.04 Billion by 2033, exhibiting a CAGR of 15.56% during 2025-2033. North America currently dominates the market, holding a significant market share of over 45% in 2024. The widespread product adoption in the power generation industry, extensive research and development (R&D) activities, and the increasing product demand in the marine industry represent some of the key factors driving the market.
|
Report Attribute
|
Key Statistics
|
|---|---|
|
Base Year
|
2024
|
|
Forecast Years
|
2025-2033
|
|
Historical Years
|
2019-2024
|
|
Market Size in 2024
|
USD 8.95 Billion |
|
Market Forecast in 2033
|
USD 35.04 Billion |
| Market Growth Rate (2025-2033) | 15.56% |
The visual analytics market is expanding due to rising demand for data-driven decision-making, real-time insights, and business intelligence across industries. Increasing data volumes from IoT, social media, and enterprise applications drive adoption, as organizations seek advanced tools for pattern recognition and predictive analytics. The growing integration of AI and machine learning enhances visualization capabilities, improving accuracy and automation. Cloud-based solutions enable scalability and cost efficiency, attracting businesses of all sizes. Stringent compliance regulations push industries to adopt transparent, visual reporting tools. Additionally, the need for fraud detection, risk management, and operational efficiency in BFSI, healthcare, and supply chain sectors accelerates adoption. Enhanced user-friendly dashboards and self-service analytics also contribute to the visual analytics market growth.
The visual analytics market in the United States is growing due to increasing data-driven decision-making across industries, rising adoption of AI and machine learning, and expanding cloud-based analytics solutions. The BFSI, healthcare, and supply chain sectors drive demand for fraud detection, risk assessment, and operational efficiency. Stringent regulatory compliance, such as HIPAA and SEC guidelines, accelerates the adoption of visual analytics for transparent reporting. This represents one of the key visual analytics market trends in the country. Growing investments in big data, IoT, and business intelligence tools enhance market expansion. Additionally, enterprises seek real-time insights and predictive analytics to improve customer engagement, optimize processes, and gain a competitive edge in a data-intensive economy. For instance, in November 2023, Goldman Sachs announced the launch of Marquee MarketView, a new visual analytics dashboarding system, to streamline its institutional clients' investment processes in international markets. Institutional investors and corporate clients can use the new service via Goldman Sachs' digital platform Marquee.
Visual Analytics Market Trends:
Growing Demand for Visual Analytics in the BFSI Sector
The growing demand for visual analytics in the banking, financial services, and insurance (BFSI) sector is a major factor driving the visual analytics industry. This demand is fueled by the need to simplify workloads related to security and the need to manage the large amounts of data generated by IT systems during financial transactions. The global BFSI security market size was valued at USD 65.7 Billion in 2024. These solutions aid in data-driven decision-making, which eases the process of analyzing large datasets. These factors are becoming increasingly important in the BFSI sector and driving industry growth.
Integration of Advanced Technologies
The integration of advanced technologies, such as AI, cloud computing, and virtual reality (VR), is also increasing the visual analytics market share. The global virtual reality market size was valued at USD 15.9 Billion in 2024. These technologies can predict consumer preferences and improve product development by optimizing marketing strategies. Advanced visualization tools are, therefore, being increasingly adopted by enterprises to improve their data analysis and decision-making processes, which further supports market growth. Besides this, medium and large enterprises are employing visual analytics to project data across multiple platforms such as desktops and smartphones, thereby ensuring smooth access to insights.
Expanding Use in Healthcare and other Industries
Visual analytics are becoming popular in the healthcare industry. In this sector, these solutions help professionals to analyze and communicate complex information, which helps in better clinical and administrative decision-making. Industry reports indicate that approximately 70% of health system respondents expect AI to significantly impact their organizations, leading to a shift in AI strategies from the IT department to executive leadership. Visual analytics give insight into patient care and operational efficiency by transforming large amounts of healthcare data into communicative visualizations. Market growth is also driven by the widespread adoption of cloud technology solutions and government initiatives for digitization. Extensive research and development (R&D) measures are also giving rise to more sophisticated visual analytics tools, driving their adoption in numerous industries.
Visual Analytics Industry Segmentation:
IMARC Group provides an analysis of the key trends in each segment of the global visual analytics market, along with forecasts at the global, regional, and country levels from 2025-2033. The market has been categorized based on component, service, deployment mode, enterprise size, business function, and industry vertical.
Analysis by Component:
- Software
- Service
Services dominate the visual analytics market due to the increasing demand for customized solutions, consulting, and training. Enterprises require expert guidance for integration, data interpretation, and optimization of analytics platforms. Managed services help organizations with real-time insights, maintenance, and scalability, reducing the need for in-house expertise. Cloud-based visual analytics adoption further fuels service demand, as businesses seek seamless deployment and continuous support. Additionally, compliance and security concerns drive reliance on professional services. Vendors offer tailored analytics solutions for various industries, reinforcing service-led market expansion. The rising complexity of big data analytics strengthens service providers' role in maximizing value.
Analysis by Service Insights:
- Managed Service
- Professional Service
- Consulting Services
- Deployment and Integration
- Support and Maintenance
Managed services hold the largest share in the visual analytics market because organizations need ongoing data observation and instant insights while maintaining affordable scalability. Organizations prefer to outsource their analytics management as it reduces costs by removing the need for infrastructure while improving operational speed and enabling smooth system connections. Managed service providers give knowledge about data governance while handling both security needs and compliance requirements to support enterprise requirements. Cloud analytics has accelerated market demand because organizations require adaptable subscription models for their data management needs. Businesses gain maximal value from their data with the help of managed services that leverage AI automation, predictive analytics and dashboard optimization features without the need for complex in-house expertise.
Analysis by Deployment Mode:
- On-premises
- Cloud-based
On-premises leads the market with around 68.7% of the market share in 2024. On-premises deployment holds the largest share in the visual analytics market due to stringent data security, compliance requirements, and the need for full control over analytics infrastructure. Enterprises in banking, healthcare, and government sectors prioritize on-premises solutions to protect sensitive data and meet regulatory standards. These solutions offer lower latency, high customization, and seamless integration with legacy systems. Organizations with large-scale data processing needs prefer on-premises deployment for enhanced performance and reliability. Additionally, industries dealing with proprietary or confidential data rely on localized storage and processing to mitigate cybersecurity risks, reinforcing the dominance of on-premises visual analytics solutions.
Analysis by Enterprise Size:
- Large Enterprises
- Small and Medium-sized Enterprises (SMEs)
Large enterprises lead the market with around 65% of the market share in 2024. Large enterprises hold the largest share in the visual analytics market due to their extensive data volumes, complex operations, and higher IT budgets. They invest in advanced analytics solutions for real-time decision-making, competitive intelligence, and operational efficiency. These organizations prioritize data-driven strategies, leveraging visual analytics for predictive modeling, customer insights, and risk assessment. Compliance requirements and data security concerns drive their adoption of robust analytics platforms. Large enterprises also demand scalable, customized solutions with seamless integration into existing infrastructure. Their need for dedicated IT teams, managed services, and advanced AI-driven analytics further solidifies their dominance in the market.
Analysis by Business Function:
- Information Technology (IT)
- Sales and Marketing
- Supply Chain
- Finance
- Human Resources (HR)
- Others
The supply chain sector holds the largest share of the visual analytics market because organizations seek immediate monitoring alongside planning capabilities and operational enhancement. Through visual analytics, companies achieve superior logistics results while managing inventory better and boosting supplier capabilities which leads to cost reduction and better decisions. The combination of advanced analytics serves to detect operational problems make route optimization forecasts and track supply chain disruptions more accurately. IoT integration combined with AI-driven analysis promotes the adoption process through predictive maintenance capabilities, which also help minimize risks. Businesses depend on data visualization to achieve transparency and compliance as well as agility through their procurement, warehousing, and distribution networks because global supply chains have become complex.
Analysis by Industry Vertical:
- BFSI
- Telecom and IT
- Retail and Consumer Goods
- Healthcare and Life Sciences
- Manufacturing
- Government and Defense
- Energy and Utilities
- Media and Entertainment
- Transportation and Logistics
- Others
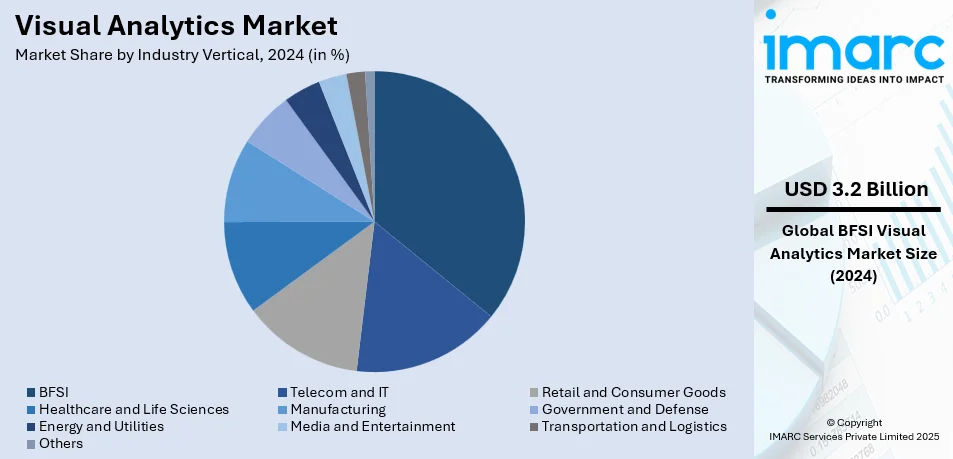
BFSI leads the market with around 35.8% of the market share in 2024. The BFSI sector holds the largest share of the visual analytics market due to its reliance on data-driven decision-making for risk management, fraud detection, and regulatory compliance. Banks and financial institutions use visual analytics to analyze large datasets, detect anomalies, and enhance customer insights. Real-time monitoring of transactions helps in identifying fraudulent activities, while predictive analytics optimizes investment strategies and credit risk assessments. Compliance with stringent financial regulations drives demand for transparent, visual reporting. Additionally, customer analytics improves personalized banking experiences, boosting engagement and retention. The sector’s need for high-security, AI-driven analytics further strengthens its market dominance.
Regional Analysis:
- North America
- United States
- Canada
- Asia Pacific
- China
- Japan
- India
- South Korea
- Australia
- Indonesia
- Others
- Europe
- Germany
- France
- United Kingdom
- Italy
- Spain
- Russia
- Others
- Latin America
- Brazil
- Mexico
- Others
- Middle East and Africa
In 2024, North America accounted for the largest market share of over 45%. In North America, the visual analytics market is driven by rapid digital transformation across industries, particularly in finance, healthcare, and retail. The region’s strong adoption of big data, cloud computing, and AI technologies fosters demand for advanced analytics tools. Businesses prioritize data-driven decision-making, real-time insights, and operational efficiency, propelling the need for visual analytics platforms. Regulatory requirements, such as HIPAA and financial compliance standards, further stimulate market growth by encouraging transparent and secure data reporting. North America's well-developed infrastructure, high internet penetration, and growing emphasis on predictive analytics and business intelligence also contribute to market expansion. Additionally, increasing investments in IoT and the rise of data-driven startups accelerate the adoption of visual analytics solutions across the region. For instance, in March 2023, iWave, announced the release of its new interactive dashboards and visual analytics for charitable, healthcare, and educational institutions. With the help of iWave's robust dashboard suite, organizations can swiftly see trends and opportunities among their donors and prospects and make timely operational and strategic choices.
Key Regional Takeaways:
United States Visual Analytics Market Analysis
In 2024, the United States accounted for the largest market share of over 88.5% in North America. The visual analytics market in the United States is significantly driven by the increasing demand for data-driven decision-making across various industries, including healthcare, retail, finance, and manufacturing. The growth in big data analytics, coupled with the need to process and visualize large volumes of complex data, is driving businesses to adopt visual analytics solutions. A notable factor contributing to the market's expansion is the country's strong AI startup ecosystem. According to reports, the U.S. has been the breeding ground for most AI startups, with 4,633 AI startups founded between 2013 and 2022. In 2022 alone, 524 AI startups were established, attracting USD 47 Billion in non-governmental funding. This surge in AI innovation is boosting the demand for visual analytics tools that leverage AI and machine learning for accurate, real-time insights. Furthermore, the rise of cloud technologies is making these tools more scalable and accessible to businesses of all sizes. The growing focus on personalized customer experiences and the self-service analytics trend are also playing a key role in the adoption of visual analytics solutions. Additionally, government investments in smart city initiatives are contributing to the visual analytics market demand.
Asia Pacific Visual Analytics Market Analysis
The visual analytics market in Asia-Pacific (APAC) is being driven by the rapid digital transformation across key sectors such as manufacturing, retail, and government services. The increasing volume of data generated by businesses, combined with the need for real-time insights, is fueling demand for visual analytics tools. Additionally, cloud computing is emerging as a dominant technology in the region. According to reports, 85% of business leaders in APAC have already begun adopting cloud technologies, highlighting the widespread shift towards scalable and flexible solutions. This trend, along with the growing adoption of big data technologies, is creating new opportunities for visual analytics, especially among small and medium-sized enterprises (SMEs) in countries like India and China. Furthermore, government initiatives promoting digitalization in countries like Singapore, Japan, and South Korea are further accelerating market growth in the region.
Europe Visual Analytics Market Analysis
The visual analytics market in Europe is expanding as businesses increasingly seek advanced tools to extract valuable insights from large datasets. This demand is particularly strong in industries such as automotive, finance, and healthcare, where improved decision-making and operational efficiency are essential. A key factor driving market growth is the widespread adoption of technologies like artificial intelligence (AI) and machine learning, which enhance the accuracy and speed of visual analytics. The rapid adoption of cloud computing also plays a pivotal role, offering scalability and cost-efficiency. Furthermore, the European Union’s emphasis on digital transformation and sustainable innovation is accelerating the use of visual analytics tools. According to reports, in 2021, 29% of EU enterprises utilized Internet of Things (IoT) devices, primarily for securing their premises, indicating the growing role of connected devices in driving data collection and analytics. As IoT devices generate vast amounts of data, the need for efficient visual analytics solutions to interpret and act on this data is increasing. Moreover, stringent data privacy regulations, like the GDPR, are pushing organizations to adopt more sophisticated tools for data management and compliance, further driving the demand for visual analytics.
Latin America Visual Analytics Market Analysis
In Latin America, the visual analytics market is propelled by the region’s growing digitalization, particularly in sectors like retail, finance, and government. The increasing adoption of cloud computing and big data solutions is enabling businesses to efficiently analyze large datasets, driving demand for visual analytics tools. According to GSMA, mobile technologies and services contributed 8% to the region’s GDP in 2023, amounting to USD 520 Billion in economic value added. This rapid adoption of digital technologies is further fueling the demand for data visualization to support informed business decisions and enhance customer experiences.
Middle East and Africa Visual Analytics Market Analysis
The visual analytics market in the Middle East and Africa is experiencing growth driven by rapid technological adoption in sectors like oil and gas, healthcare, and retail. A key contributor is the rise of IoT and smart city projects, with the MENA region having 0.28 Billion IoT devices in 2023, according to industry reports. This proliferation of connected devices generates large volumes of data, which businesses are increasingly using to drive insights through visual analytics tools. Additionally, the region’s growing focus on digital transformation and smart infrastructure is expected to continue to fuel demand for advanced analytics solutions.
Competitive Landscape:
The visual analytics market is highly competitive, with key players focusing on AI integration, cloud-based solutions, and advanced data visualization tools. Major companies include Tableau (Salesforce), Microsoft Power BI, Qlik, SAS Institute, IBM, Oracle, and SAP, offering robust analytics platforms with predictive and real-time capabilities. Startups and niche providers compete by delivering industry-specific solutions and enhanced self-service analytics. Partnerships, acquisitions, and R&D investments drive innovation, while cloud adoption expands market reach. Companies differentiate through AI-driven insights, intuitive dashboards, and seamless enterprise integration. Competitive pressure is intensifying as businesses demand scalable, cost-effective solutions for big data analytics and decision-making.
The report has also analysed the competitive landscape of the market with some of the key players being:
- Alteryx Inc.
- Data Clarity Limited
- International Business Machines Corporation
- Microsoft Corporation
- Oracle Corporation
- Qlik
- SAP SE
- SAS Institute Inc.
- Tableau Software LLC (Salesforce Inc.)
- TIBCO Software Inc.
- Ubiq
Latest News and Developments:
- November 2024: InfoVision Inc. has launched AlphaMetricx (AMX), an AI-powered media analytics platform designed for media analysts and corporate communicators. AMX utilizes AI and custom large language models (LLMs) to provide real-time media insights, streamline workflows, and deliver a tailored user experience. Available through a yearly subscription, the platform offers advanced media monitoring, customized insight dashboards, and metrics like PR Impact Score and PR Message Congruence.
- October 2024: Presight and ISS, two premier AI-driven data and visual analytics companies, have extended their strategic international partnership through a commercial agreement. As part of this collaboration, ISS will implement the AI-driven data analytics solutions of Presight for its end users in North and Latin America. Similarly, Presight plans to deploy the SecurOS (r) video and sensor platform of ISS in its domestic and international operations in the UAE.
- March 2024: SAP Analytics Cloud was launched on Apple Vision Pro, offering an optimized, interactive experience for exploring business data. The app included features like filter selection, drill-down, and drag-and-drop for creating custom boards. Users needed SAP Analytics Cloud with mobile services enabled, showcasing how technology enhanced business data management.
- March 2024: Aimpoint Digital, a leading analytics and data engineering firm, has established a partnership with Sigma to revolutionize visual analytics solutions and application development. This collaboration aims to enhance the services provided by Aimpoint Digital.
- March 2024: Standard AI has launched Vision Analytics, a new product suite designed to provide retailers and brands with insights into shopper behavior, product performance, and store operations using AI and computer vision. The platform offers unparalleled data capture of interactions, products, and people within physical retail environments.
Visual Analytics Market Report Scope:
| Report Features | Details |
|---|---|
| Base Year of the Analysis | 2024 |
| Historical Period | 2019-2024 |
| Forecast Period | 2025-2033 |
| Units | Billion USD |
| Scope of the Report |
Exploration of Historical Trends and Market Outlook, Industry Catalysts and Challenges, Segment-Wise Historical and Future Market Assessment:
|
| Components Covered | Software, Service |
| Services Covered |
|
| Deployment Modes Covered | On-premises, Cloud-based |
| Enterprise Sizes Covered | Large Enterprises, Small and Medium-sized Enterprises (SMEs) |
| Business Functions Covered | Information Technology (IT), Sales and Marketing, Supply Chain, Finance, Human Resources (HR), Others |
| Industry Verticals Covered | BFSI, Telecom and IT, Retail and Consumer Goods, Healthcare and Life Sciences, Manufacturing, Government and Defense, Energy and Utilities, Media and Entertainment, Transportation and Logistics, Others |
| Regions Covered | Asia Pacific, Europe, North America, Latin America, Middle East and Africa |
| Countries Covered | United States, Canada, Germany, France, United Kingdom, Italy, Spain, Russia, China, Japan, India, South Korea, Australia, Indonesia, Brazil, Mexico |
| Companies Covered | Alteryx Inc., Data Clarity Limited, International Business Machines Corporation, Microsoft Corporation, Oracle Corporation, Qlik, SAP SE, SAS Institute Inc., Tableau Software LLC (Salesforce Inc.), TIBCO Software Inc., Ubiq, etc. |
| Customization Scope | 10% Free Customization |
| Post-Sale Analyst Support | 10-12 Weeks |
| Delivery Format | PDF and Excel through Email (We can also provide the editable version of the report in PPT/Word format on special request) |
Key Benefits for Stakeholders:
- IMARC’s report offers a comprehensive quantitative analysis of various market segments, historical and current market trends, market forecasts, and dynamics of the visual analytics market from 2019-2033.
- The visual analytics market research report provides the latest information on the market drivers, challenges, and opportunities in the global market.
- The study maps the leading, as well as the fastest-growing, regional markets. It further enables stakeholders to identify the key country-level markets within each region.
- Porter's five forces analysis assist stakeholders in assessing the impact of new entrants, competitive rivalry, supplier power, buyer power, and the threat of substitution. It helps stakeholders to analyze the level of competition within the visual analytics industry and its attractiveness.
- Competitive landscape allows stakeholders to understand their competitive environment and provides an insight into the current positions of key players in the market.
Key Questions Answered in This Report
The visual analytics market was valued at USD 8.95 Billion in 2024.
The visual analytics market is projected to exhibit a CAGR of 15.56% during 2025-2033, reaching a value of USD 35.04 Billion by 2033.
The key factors driving the visual analytics market include increasing data volumes, the need for real-time insights, AI integration, and growing cloud adoption. Demand for data-driven decision-making, predictive analytics, and operational efficiency across industries like BFSI, healthcare, and retail, along with regulatory compliance requirements, further creating a positive visual analytics market outlook.
North America currently dominates the visual analytics market, accounting for a share of 45%. The factors driving the North American visual analytics market include data-driven decision-making, AI integration, cloud adoption, and regulatory compliance.
Some of the major players in the visual analytics market include Alteryx Inc., Data Clarity Limited, International Business Machines Corporation, Microsoft Corporation, Oracle Corporation, Qlik, SAP SE, SAS Institute Inc., Tableau Software LLC (Salesforce Inc.), TIBCO Software Inc., Ubiq, etc.
Need more help?
- Speak to our experienced analysts for insights on the current market scenarios.
- Include additional segments and countries to customize the report as per your requirement.
- Gain an unparalleled competitive advantage in your domain by understanding how to utilize the report and positively impacting your operations and revenue.
- For further assistance, please connect with our analysts.
 Request Customization
 Speak to an Analyst
 Request Brochure
 Inquire Before Buying
Benefits of Customization
- Personalize this research
- Triangulate with your data
- Get data as per your format and definition
- Gain a deeper dive into a specific application, geography, customer, or competitor
- Any level of personalization
Get in Touch With Us
UNITED STATES
Phone: +1-201-971-6302
INDIA
Phone: +91-120-433-0800
UNITED KINGDOM
Phone: +44-753-714-6104
Email: sales@imarcgroup.com
Client Testimonials


.webp)


