
United States Urea Market Report by Grade (Fertilizers Grade, Feed Grade, Technical Grade), Application (Nitrogenous Fertilizer, Stabilizing Agent, Keratolytic, Resin, and Others), End Use Industry (Agriculture, Chemical, Automotive, Medical, and Others), and Region 2025-2033
United States Urea Market Size, Share & Outlook
United States urea market size is projected to exhibit a growth rate (CAGR) of 5.3% during 2025-2033. The increasing advances in urea production technologies and formulations that can influence the industry by improving efficiency, reducing costs, and enhancing the environmental sustainability of urea-based products, are driving the market.
|
Report Attribute
|
Key Statistics
|
|---|---|
|
Base Year
|
2024 |
|
Forecast Years
|
2025-2033
|
|
Historical Years
|
2019-2024
|
| Market Growth Rate (2025-2033) | 5.3% |
Urea is a chemical compound with the formula (NH₂)₂CO, composed of carbon, nitrogen, oxygen, and hydrogen. It is a crucial organic compound widely known for its presence in urine, where it serves as the primary nitrogenous waste product excreted by mammals. Urea plays a vital role in the nitrogen cycle, as it is a source of nitrogen that can be converted into ammonia and, ultimately, into various nitrogen-containing compounds by bacteria in the soil. This makes urea a significant component of fertilizers, promoting plant growth and agricultural productivity. Additionally, urea has diverse industrial applications, including in the production of plastics, resins, and adhesives. Its versatility and importance in biological and industrial processes underscore urea's significance in various scientific, agricultural, and industrial fields.
United States Urea Market Trends:
The urea market in the United States is influenced by several key drivers, contributing to its dynamic growth and stability. Firstly, the increasing regional demand for food security propels the demand for urea as a crucial nitrogen fertilizer. This demand is particularly pronounced in the United States, where population growth and changing dietary habits drive agricultural expansion. Moreover, the growing trend towards sustainable agriculture has led to a surge in urea utilization, as it is considered a more environmentally friendly nitrogen source compared to traditional alternatives. Furthermore, the energy sector plays a pivotal role in shaping the urea market dynamics. The fluctuating prices of natural gas, a primary raw material for urea production, significantly impact the overall cost structure of urea manufacturing. Additionally, government policies and subsidies influence the market by incentivizing or regulating urea production and consumption. The ongoing technological advancements in urea production processes also contribute to market growth, improving efficiency and reducing environmental impact. In conclusion, the urea market in the United States is intricately connected to regional trends in agriculture, energy, and technology. Understanding these interdependencies is crucial for stakeholders to navigate the market and capitalize on emerging opportunities.
United States Urea Market Segmentation:
IMARC Group provides an analysis of the key trends in each segment of the market, along with forecasts at the country level for 2025-2033. Our report has categorized the market based on grade, application, and end use industry.
Grade Insights:
- Fertilizers Grade
- Feed Grade
- Technical Grade
The report has provided a detailed breakup and analysis of the market based on the grade. This includes fertilizers grade, feed grade, and technical grade.
Application Insights:
- Nitrogenous Fertilizer
- Stabilizing Agent
- Keratolytic
- Resin
- Others
A detailed breakup and analysis of the market based on the application have also been provided in the report. This includes nitrogenous fertilizer, stabilizing agent, keratolytic, resin, and others.
End Use Industry Insights:
- Agriculture
- Chemical
- Automotive
- Medical
- Others
The report has provided a detailed breakup and analysis of the market based on the end use industry. This includes agriculture, chemical, automotive, medical, and others.
Regional Insights:
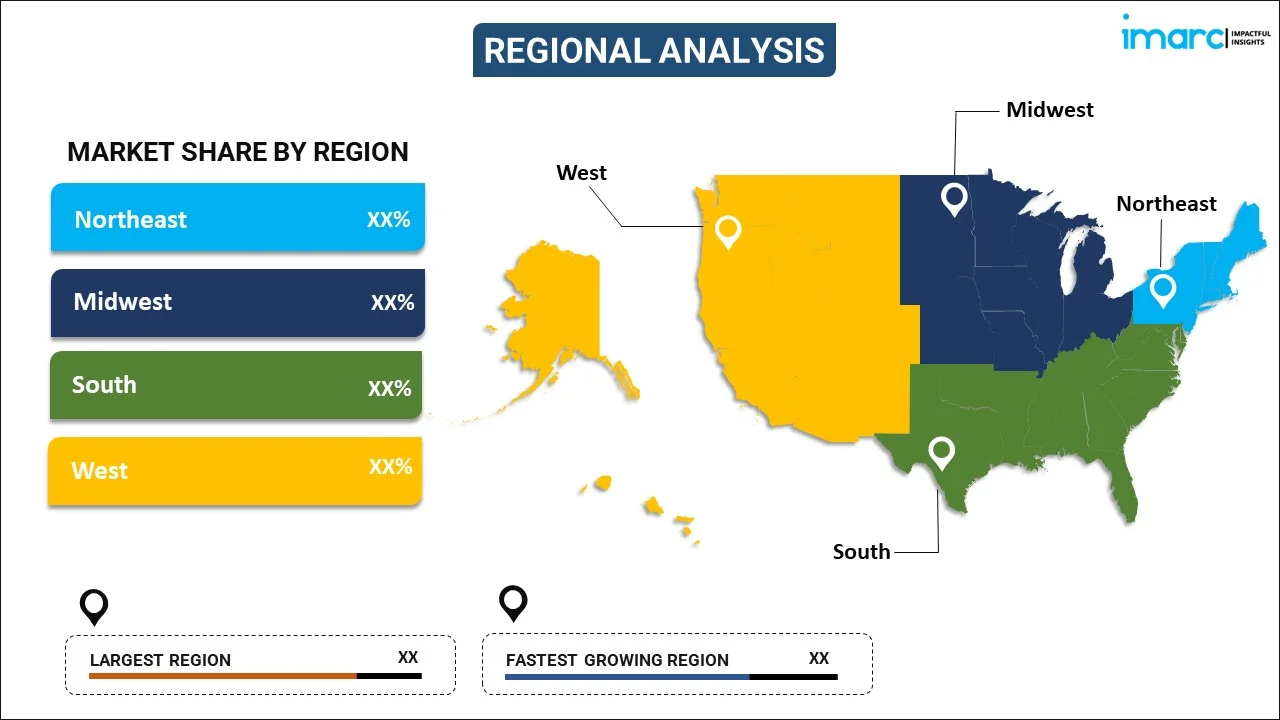
- Northeast
- Midwest
- South
- West
The report has also provided a comprehensive analysis of all the major regional markets, which include Northeast, Midwest, South, and West.
Competitive Landscape:
The market research report has also provided a comprehensive analysis of the competitive landscape. Competitive analysis such as market structure, key player positioning, top winning strategies, competitive dashboard, and company evaluation quadrant has been covered in the report. Also, detailed profiles of all major companies have been provided. Some of the key players include:
- CF Industries Holdings Inc
- CJ Chemicals
- Dakota Gasification Company
- Koch Fertilizer LLC
- Yara North America Inc
(Please note that this is only a partial list of the key players, and the complete list is provided in the report.)
United States Urea Market Report Coverage:
| Report Features | Details |
|---|---|
| Base Year of the Analysis | 2024 |
| Historical Period | 2019-2024 |
| Forecast Period | 2025-2033 |
| Units | Million USD |
| Scope of the Report | Exploration of Historical and Forecast Trends, Industry Catalysts and Challenges, Segment-Wise Historical and Predictive Market Assessment:
|
| Grades Covered | Fertilizers Grade, Feed Grade, Technical Grade |
| Applications Covered | Nitrogenous Fertilizer, Stabilizing Agent, Keratolytic, Resin, Others |
| End Use Industries Covered | Agriculture, Chemical, Automotive, Medical, Others |
| Regions Covered | Northeast, Midwest, South, West |
| Companies Covered | CF Industries Holdings Inc, CJ Chemicals, Dakota Gasification Company, Koch Fertilizer LLC, Yara North America Inc, etc. |
| Customization Scope | 10% Free Customization |
| Post-Sale Analyst Support | 10-12 Weeks |
| Delivery Format | PDF and Excel through Email (We can also provide the editable version of the report in PPT/Word format on special request) |
Key Questions Answered in This Report:
- How has the United States urea market performed so far and how will it perform in the coming years?
- What has been the impact of COVID-19 on the United States urea market?
- What is the breakup of the United States urea market on the basis of grade?
- What is the breakup of the United States urea market on the basis of application?
- What is the breakup of the United States urea market on the basis of end use industry?
- What are the various stages in the value chain of the United States urea market?
- What are the key driving factors and challenges in the United States urea?
- What is the structure of the United States urea market and who are the key players?
- What is the degree of competition in the United States urea market?
Key Benefits for Stakeholders:
- IMARC’s industry report offers a comprehensive quantitative analysis of various market segments, historical and current market trends, market forecasts, and dynamics of the United States urea market from 2019-2033.
- The research report provides the latest information on the market drivers, challenges, and opportunities in the United States urea market.
- Porter's five forces analysis assist stakeholders in assessing the impact of new entrants, competitive rivalry, supplier power, buyer power, and the threat of substitution. It helps stakeholders to analyze the level of competition within the United States urea industry and its attractiveness.
- Competitive landscape allows stakeholders to understand their competitive environment and provides an insight into the current positions of key players in the market.
Need more help?
- Speak to our experienced analysts for insights on the current market scenarios.
- Include additional segments and countries to customize the report as per your requirement.
- Gain an unparalleled competitive advantage in your domain by understanding how to utilize the report and positively impacting your operations and revenue.
- For further assistance, please connect with our analysts.
 Request Customization
 Speak to an Analyst
 Request Brochure
 Inquire Before Buying
Benefits of Customization
- Personalize this research
- Triangulate with your data
- Get data as per your format and definition
- Gain a deeper dive into a specific application, geography, customer, or competitor
- Any level of personalization
Get in Touch With Us
UNITED STATES
Phone: +1-201-971-6302
INDIA
Phone: +91-120-433-0800
UNITED KINGDOM
Phone: +44-753-714-6104
Email: sales@imarcgroup.com
Client Testimonials


.webp)


