United States Stylus Pen Market Report by Product Type (Resistive Stylus, Capacitive Stylus, Active Stylus), Distribution Channel (Online, Offline), Application (Smart Phones, Tablets, Interactive Whiteboards), End User (OEM, Retail), and Region 2025-2033
Market Overview:
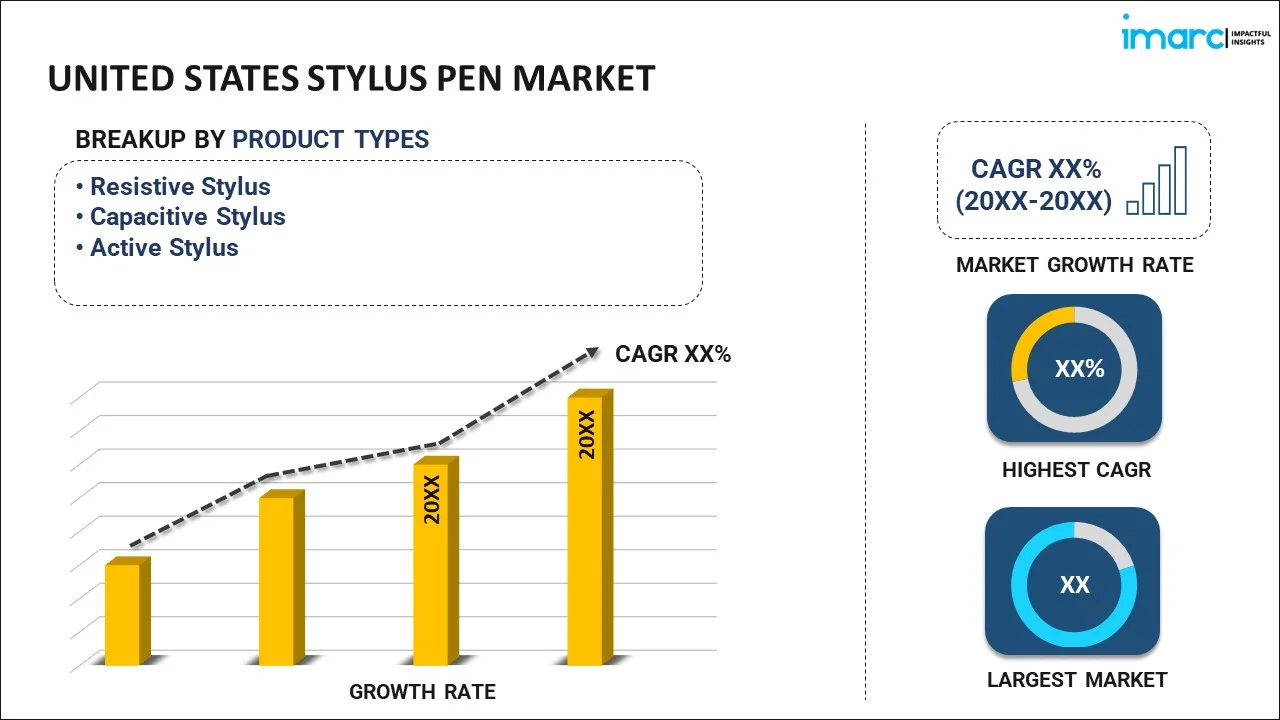
The United States stylus pen market size reached USD 4,900.5 Million in 2024. Looking forward, IMARC Group expects the market to reach USD 9,750.8 Million by 2033, exhibiting a growth rate (CAGR) of 7.55% during 2025-2033.
|
Report Attribute
|
Key Statistics
|
|---|---|
|
Base Year
|
2024
|
|
Forecast Years
|
2025-2033
|
|
Historical Years
|
2019-2024
|
|
Market Size in 2024
|
USD 4,900.5 Million |
|
Market Forecast in 2033
|
USD 9,750.8 Million |
| Market Growth Rate (2025-2033) | 7.55% |
A stylus pen refers to an instrument with a round rubber piece used to input commands onto a mobile device, graphic tablet, or a computer screen. It is also utilized to make selections by tapping on the touchscreen device or by drawing an instruction. The stylus pen facilitates a smudge-free swiping experience as it consists of finer touchpoints, which offer better precision, like keys on the keyboard. The use of a stylus pen also provides better control with lesser typos or wrongly selected apps. It also highlights phrases within larger texts and offers an enhanced experience of drawing or sketching.
The United States stylus pen market is primarily driven by the rising demand for high-end gadgets. In line with this, the increasing use of digital devices for recreational activities, such as coloring, is also positively impacting the market growth. Besides this, the adoption of digital menus in various restaurants and other emerging trends, like e-educators providing education through online mediums, is also propelling the market growth. Moreover, the leading companies are making considerable investments in product innovation and are offering built-in styluses to improve usability and convenience.
Key Market Segmentation:
IMARC Group provides an analysis of the key trends in each sub-segment of the United States stylus pen market report, along with forecasts at the country level from 2025-2033. Our report has categorized the market based on product type, distribution channel, application, and end user.
Breakup by Product Type:

- Resistive Stylus
- Capacitive Stylus
- Active Stylus
Breakup by Distribution Channel:
- Online
- Offline
Breakup by Application:
- Smart Phones
- Tablets
- Interactive Whiteboards
Breakup by End User:
- OEM
- Retail
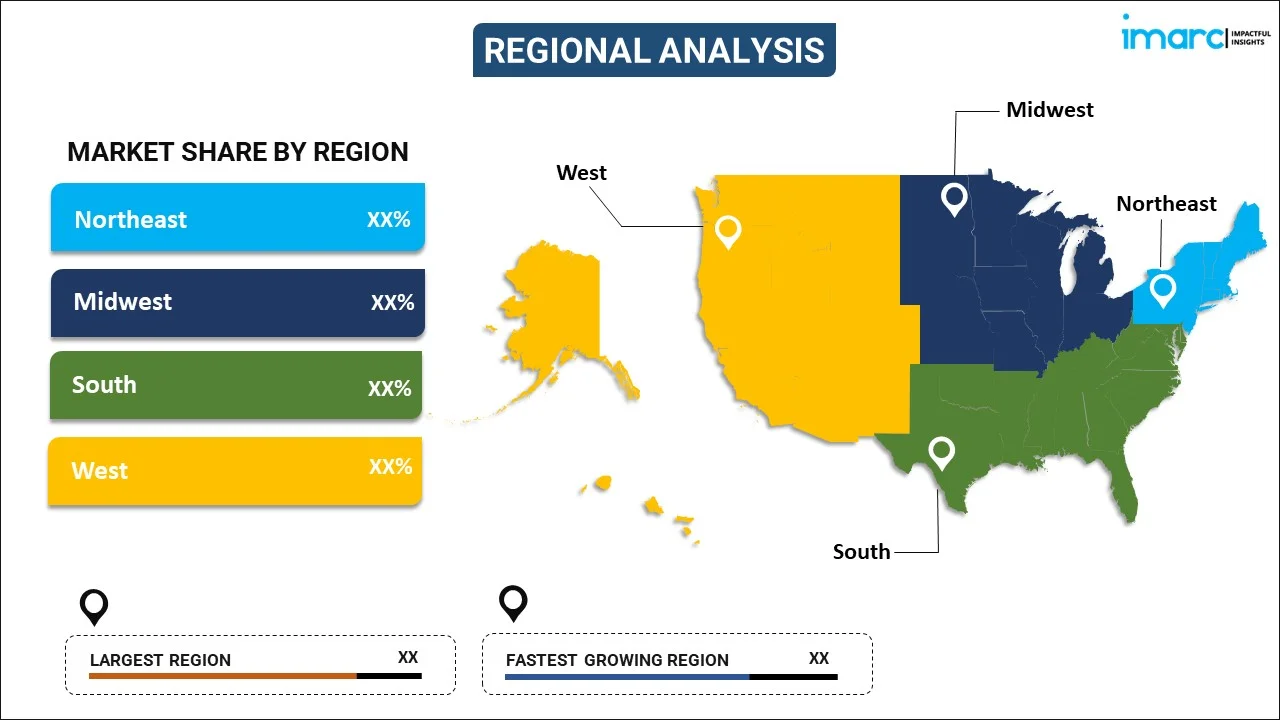
Breakup by Region:

- Northeast
- Midwest
- South
- West
Competitive Landscape:
The competitive landscape of the industry has also been examined along with the profiles of the key players.
Report Coverage:
| Report Features | Details |
|---|---|
| Base Year of the Analysis | 2024 |
| Historical Period | 2019-2024 |
| Forecast Period | 2025-2033 |
| Units | Million USD |
| Segment Coverage | Product Type, Distributor Channel, Application, End User, Region |
| Region Covered | Northeast, Midwest, South, West |
| Customization Scope | 10% Free Customization |
| Post-Sale Analyst Support | 10-12 Weeks |
| Delivery Format | PDF and Excel through Email (We can also provide the editable version of the report in PPT/Word format on special request) |
Key Questions Answered in This Report:
- How has the United States stylus pen market performed so far and how will it perform in the coming years?
- What has been the impact of COVID-19 on the United States stylus pen market?
- What are the key regional markets?
- What is the breakup of the market based on the product type?
- What is the breakup of the market based on the distribution channel?
- What is the breakup of the market based on the application?
- What is the breakup of the market based on the end user?
- What are the various stages in the value chain of the industry?
- What are the key driving factors and challenges in the industry?
- What is the structure of the United States stylus pen market and who are the key players?
- What is the degree of competition in the industry?
Need more help?
- Speak to our experienced analysts for insights on the current market scenarios.
- Include additional segments and countries to customize the report as per your requirement.
- Gain an unparalleled competitive advantage in your domain by understanding how to utilize the report and positively impacting your operations and revenue.
- For further assistance, please connect with our analysts.
 Request Customization
 Speak to an Analyst
 Request Brochure
 Inquire Before Buying


.webp)


.webp)


