United States Soundbar Market Report by Type (Wall-Mounted, Table-Top, and Others), Installation Method (Active Soundbar, Passive Soundbar, and Others), Connectivity (Wi-Fi, Bluetooth, and Others), Application (Home Audio, Commercial, and Others), and Region 2025-2033
Market Overview:
The United States soundbar market size reached USD 1,261.6 Million in 2024. Looking forward, IMARC Group expects the market to reach USD 2,299.4 Million by 2033, exhibiting a growth rate (CAGR) of 6.55% during 2025-2033.
|
Report Attribute
|
Key Statistics
|
|---|---|
|
Base Year
|
2024
|
|
Forecast Years
|
2025-2033
|
|
Historical Years
|
2019-2024
|
|
Market Size in 2024
|
USD 1,261.6 Million |
|
Market Forecast in 2033
|
USD 2,299.4 Million |
| Market Growth Rate 2025-2033 | 6.55% |
United States Soundbar Market Insights:
- Major Market Drivers: The United States soundbar market size is fueled by increasing home entertainment demand, the rise in smart TV adoption, and consumer desire for compact, high-performance audio systems that are a more affordable choice compared to traditional surround sound installations.
- Key Market Trends: Technological developments in soundbars, such as Dolby Atmos, AI, and wireless connectivity, are revolutionizing soundbars into versatile smart products. These developments are being synchronized with overall smart home trends and maximizing user convenience in residential and commercial settings.
- Competitive Landscape: The competitive landscape is defined by strong competition from international and regional brands with their varied product ranges. Strategies revolve around innovation, price, and product differentiation in terms of intelligent features and audio quality enhancements to attain more United States soundbar market share.
- Challenges and Opportunities: Although market saturation in cities and price sensitivity are challenges, opportunities exist in growth in commercial markets, providing customized solutions, and using sustainability and energy-efficient design to gain shares among consumers who care about the environment.
A soundbar, also known as a media bar or speaker bar, is a single cabinet speaker that produces the stereo effect. It is made up of various components such as stereo analog inputs and output and infrared remote control and offers wireless connectivity options and audio processing features. Soundbars simulate the surround sound effects using a virtualization technique, which involves the cross-mixing/matrix of the multi-channel sound information. It has evolved from a singular, rectangular-shaped speaker with only two channels to high-performance multi-channel surround soundbar systems. In the United States, with the adoption of flatscreen displays, particularly televisions, the usage of soundbar has increased steadily.
The United States soundbar market is primarily driven by rapid digitalization and the shift toward smart devices like laptops, smart TVs, and smartphones. The growing popularity of subscription-based media platforms like Amazon Prime, Disney+ and Netflix, which provide seamless streaming on portable devices, is also propelling the market growth. Additionally, with technological innovations, such as the introduction of 4K and 8K television technologies, the demand for soundbars has escalated across the region. Furthermore, the high internet connectivity and the integration of soundbars with voice assistants like Alexa and Google assistant are also positively impacting the market growth.
United States Soundbar Market Trends:
Increased Demand for Home Entertainment Systems
One of the most notable trends in the United States soundbar market analysis is the heightened consumer preference for an enriched home entertainment experience. As over-the-top (OTT) content and high-definition streaming increases in popularity, users are looking for more superior audio output to add to the visual content. Soundbars are gaining ground as the audio solution of choice due to their space-saving design, simple installation, and capability to provide an immersive sound experience without a need for a complete surround sound setup. With home entertainment systems being upgraded by households on a constant basis, United States Soundbar market demand is gaining strong momentum across various demographic segments. In addition, increasing disposable income along with heightening awareness among consumers regarding sound quality is fueling product uptake. This change in behavior positively drives market size, volume and revenue both showing steady growth over recent years. The market continues to show growth in urban and suburban areas alike, evidencing widespread acceptance.
Technological Integration and Smart Features
One key trend driving the United States soundbar market trends is the strong integration of newer technologies like voice assistants, Bluetooth connectivity, and Dolby Atmos support. Soundbars with artificial intelligence capabilities and multi-room features are becoming more attractive to tech-conscious consumers seeking seamless device integration. For instance, September 2023 saw Bose launching the Smart Ultra Soundbar in the United States, featuring AI-powered audio optimization and Dolby Atmos with PhaseGuide spatial technology to deliver immersive sound along with improved vocal clarity. Moreover, the introduction of smart TVs has further strengthened the need for soundbars that can connect hassle-free through wireless and HDMI ARC connections, giving a superior overall user experience. Hence, soundbars are evolving from basic audio augmentation devices to smart, multifaceted devices. This transition has resulted in significant innovation in product form and performance, adding to enhanced market share. Better connectivity options and improved sound calibration have made soundbars a key part of smart home ecosystems. Increasing innovation in this vein is anticipated to drive steady United States soundbar market growth, particularly among convenience- and integrated-technology-focused consumers.
Growing Adoption in Commercial and Hospitality Markets
Beyond domestic uses, the market is also observing amplified uptake in commercial settings like hotels, meeting halls, and malls. Companies ever more appreciate the role of soundbars to produce clear, high-fidelity sounds in small yet pleasing-looking packages. In hotels and recreational facilities, soundbars promote guest satisfaction through high-quality sounds in entertainment suites and lobbies. The professional segment is also leveraging the use of soundbars for virtual conferences and hybrid events because of their distinct audio output and support for multiple communication interfaces. This diversification of usage patterns is leading to increased market penetration and propelling the overall United States soundbar market study. Also, the commercial use of soundbars has opened up windows for product differentiation and niche offers, which is making the value chain of the market stronger. With increasing commercial demand keeping pace with consumer use, the size of the market is expected to register continued volume and revenue gains in the next few years.
Key Market Segmentation:
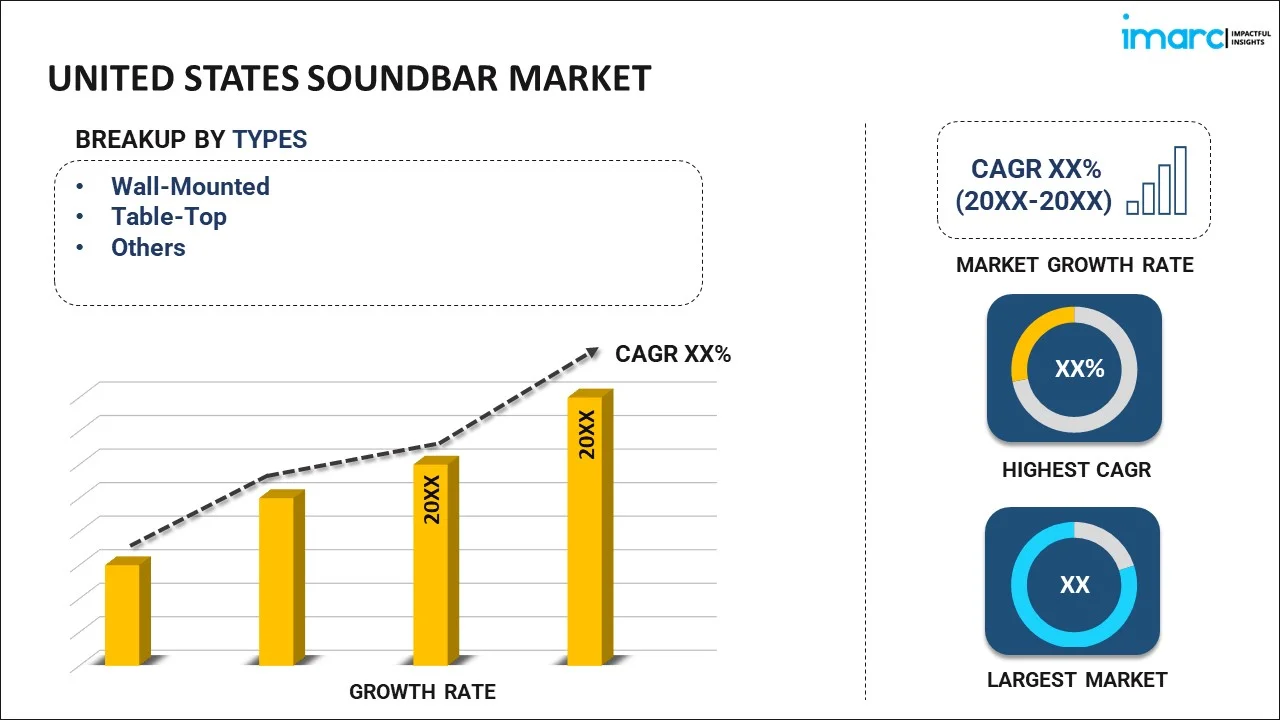
IMARC Group provides an analysis of the key trends in each sub-segment of the United States soundbar market report, along with forecasts at the country and regional level from 2025-2033. Our report has categorized the market based on type, installation method, connectivity and application.
Breakup by Type:

To get more information on this market, Request Sample
- Wall-Mounted
- Table-Top
- Others
Breakup by Installation Method:
- Active Soundbar
- Passive Soundbar
- Others
Breakup by Connectivity:
- Wi-Fi
- Bluetooth
- Others
Breakup by Application:
- Home Audio
- Commercial
- Others
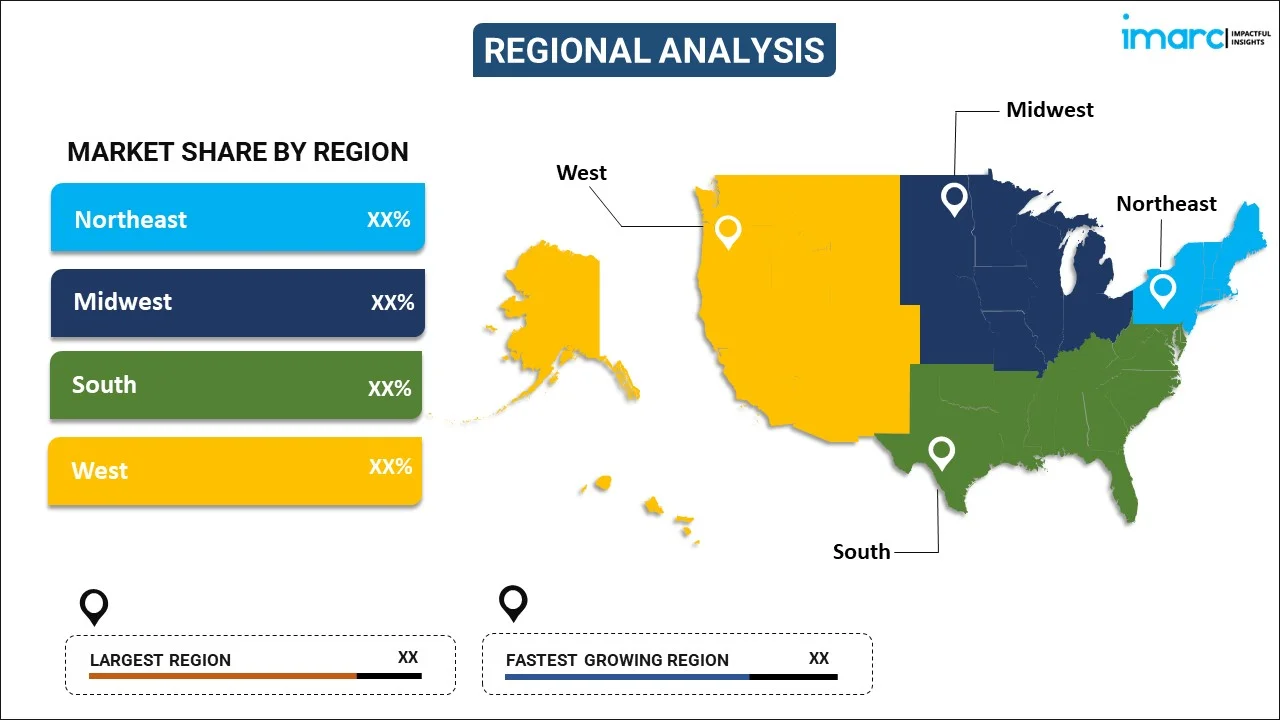
Breakup by Region:

- Northeast
- Midwest
- South
- West
Competitive Landscape:
The competitive landscape of the industry has also been examined along with the profiles of the key players.
Latest News and Developments:
- In April 2025, Samsung Electronics America introduced its 2025 soundbar offerings, the Q-series and B-series models with Dolby Atmos, AI-driven personalization, slim subwoofers, and Q-Symphony enhancements for adaptive, immersive sound. The introduction highlights upgraded bass, dialogue clarity, and room-optimized audio for upgraded home entertainment in all room sizes.
- In October 2024 – Sonos released the Arc Ultra soundbar and Sub 4 subwoofer, highlighting Sound Motion technology that boosts bass, 9.1.4 spatial audio, and sleeker design. They represent Sonos' return to hardware innovation after software upgrades and increased customer-centricity.
- In October 2024, Vizio launched the MicMe Soundbar, a 2.1-channel system with Dolby Atmos and DTS:X compatibility. For enhanced audio and karaoke experiences, it comes equipped with two wireless microphones, LED lighting effects, and the ability to access more than 85,000 songs through the MicMe Karaoke App, combining home entertainment with interactive music experiences.
Report Coverage:
| Report Features | Details |
|---|---|
| Base Year of the Analysis | 2024 |
| Historical Period | 2019-2024 |
| Forecast Period | 2025-2033 |
| Units | Million USD |
| Segment Coverage | Type, Installation Method, Connectivity, Application, Region |
| Region Covered | Northeast, Midwest, South, West |
| Customization Scope | 10% Free Customization |
| Post-Sale Analyst Support | 10-12 Weeks |
| Delivery Format | PDF and Excel through Email (We can also provide the editable version of the report in PPT/Word format on special request) |
Key Questions Answered in This Report
The soundbar market in the United States was valued at USD 1,261.6 Million in 2024.
The United States soundbar market is projected to exhibit a CAGR of 6.55% during 2025-2033, reaching a value of USD 2,299.4 Million by 2033.
Major forces behind the United States soundbar market are heightened consumer need for improved home entertainment, smart TV adoption rates, technology drivers such as wireless connectivity and voice controls, and expanded applications in commercial settings like hotels and offices looking for small form factor, high-quality audio solutions.
Need more help?
- Speak to our experienced analysts for insights on the current market scenarios.
- Include additional segments and countries to customize the report as per your requirement.
- Gain an unparalleled competitive advantage in your domain by understanding how to utilize the report and positively impacting your operations and revenue.
- For further assistance, please connect with our analysts.
 Request Customization
 Speak to an Analyst
 Request Brochure
 Inquire Before Buying


.webp)


.webp)


