
United States Solar Microinverter Market Report by Connectivity (Standalone, On-Grid), Component (Hardware, Software), Communication Channel (Wired, Wireless), Type (Single Phase, Three Phase), Application (Residential, Commercial, and Others), and Region 2026-2034
Market Overview:
The United States solar microinverter market size reached USD 473.1 Million in 2025. Looking forward, IMARC Group expects the market to reach USD 1,085.5 Million by 2034, exhibiting a growth rate (CAGR) of 9.67% during 2026-2034.
|
Report Attribute
|
Key Statistics
|
|---|---|
|
Base Year
|
2025 |
|
Forecast Years
|
2026-2034 |
|
Historical Years
|
2020-2025
|
| Market Size in 2025 | USD 473.1 Million |
| Market Forecast in 2034 | USD 1,085.5 Million |
| Market Growth Rate 2026-2034 | 9.67% |
Access the full market insights report Request Sample
A solar microinverter refers to electronic equipment that changes the waveform of the current produced by photovoltaic (PV) cells. It functions in a parallel circuit as it is used for changing direct current (DC) into alternating current (AC). Solar microinverters have the ability to maintain a consistent flow of power despite the shading of panels and have other advantages such as immense design flexibility and the capability to maximize power from solar panels by using the Maximum Point Tracking (MPPT) technology.
The United States solar microinverter market is primarily driven by the introduction of regulatory frameworks and policies to develop solar infrastructures and the rapid adoption of advanced technologies. Additionally, the rise in the demand for safe and sustainable power sources, coupled with several up-gradations in battery storage technology, are also influencing the market growth. Furthermore, there has been an increase in the development of solar power plants in the region. Along with this, the rising popularity of crystalline silicon PV modules has escalated the demand for solar microinverters across the country.
Key Market Segmentation:
IMARC Group provides an analysis of the key trends in each sub-segment of the United States solar microinverter market report, along with forecasts at the country and regional level from 2026-2034. Our report has categorized the market based on connectivity, component, communication channel, type and application.
Breakup by Connectivity:
To get detailed segment analysis of this market Request Sample
- Standalone
- On-Grid
Breakup by Component:
- Hardware
- Software
Breakup by Communication Channel:
- Wired
- Wireless
Breakup by Type:
- Single Phase
- Three Phase
Breakup by Application:
- Residential
- Commercial
- Others
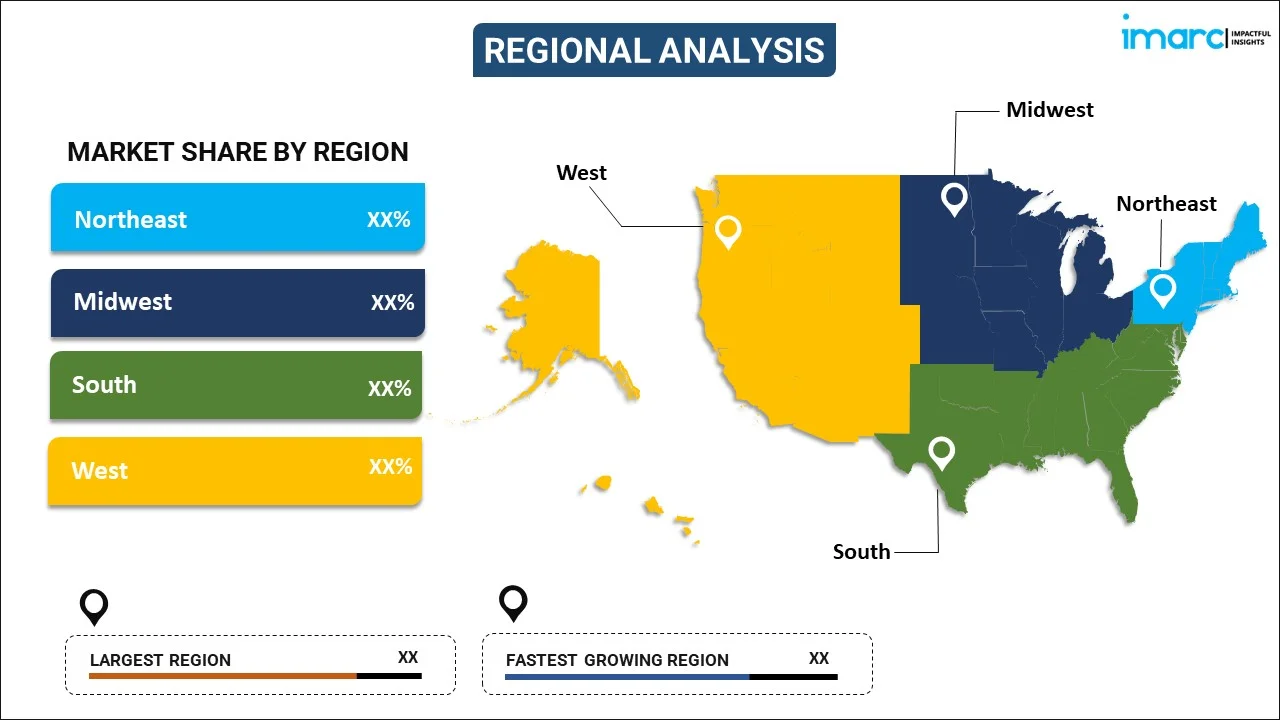
Breakup by Region:
To get detailed regional analysis of this market Request Sample
- Northeast
- Midwest
- South
- West
Competitive Landscape:
The competitive landscape of the industry has also been examined along with the profiles of the key players.
Report Coverage:
| Report Features | Details |
|---|---|
| Base Year of the Analysis | 2025 |
| Historical Period | 2020-2025 |
| Forecast Period | 2026-2034 |
| Units | Million USD |
| Segment Coverage | Connectivity, Component, Communication Channel, Type, Application, Region |
| Region Covered | Northeast, Midwest, South, West |
| Customization Scope | 10% Free Customization |
| Post-Sale Analyst Support | 10-12 Weeks |
| Delivery Format | PDF and Excel through Email (We can also provide the editable version of the report in PPT/Word format on special request) |
Key Questions Answered in This Report:
- How has the United States solar microinverter market performed so far and how will it perform in the coming years?
- What are the key regional markets?
- What is the breakup of the market based on the connectivity?
- What is the breakup of the market based on the component?
- What is the breakup of the market based on the communication channel?
- What is the breakup of the market based on the type?
- What is the breakup of the market based on the application?
- What are the various stages in the value chain of the industry?
- What are the key driving factors and challenges in the industry?
- What is the structure of the United States solar microinverter market and who are the key players?
- What is the degree of competition in the industry?
Need more help?
- Speak to our experienced analysts for insights on the current market scenarios.
- Include additional segments and countries to customize the report as per your requirement.
- Gain an unparalleled competitive advantage in your domain by understanding how to utilize the report and positively impacting your operations and revenue.
- For further assistance, please connect with our analysts.
 Request Customization
 Speak to an Analyst
 Request Brochure
 Inquire Before Buying
Benefits of Customization
- Personalize this research
- Triangulate with your data
- Get data as per your format and definition
- Gain a deeper dive into a specific application, geography, customer, or competitor
- Any level of personalization
Get in Touch With Us
UNITED STATES
Phone: +1-201-971-6302
INDIA
Phone: +91-120-433-0800
UNITED KINGDOM
Phone: +44-753-714-6104
Email: sales@imarcgroup.com
Client Testimonials


.webp)


