United States Smart Grid Security Market Report by Component (Solution, Services), Subsystem (Demand Response System, Supervisory Control and Data Acquisition (SCADA)/ Industrial Control System (ICS), Home Energy Management System, Advanced Metering Infrastructure, and Others), Deployment Type (Cloud-based, On-premise), Security Type (Endpoint Security, Application Security, Database Security, Network Security, and Others), and Region 2026-2034
United States Smart Grid Security Market Size, Share & Trends:
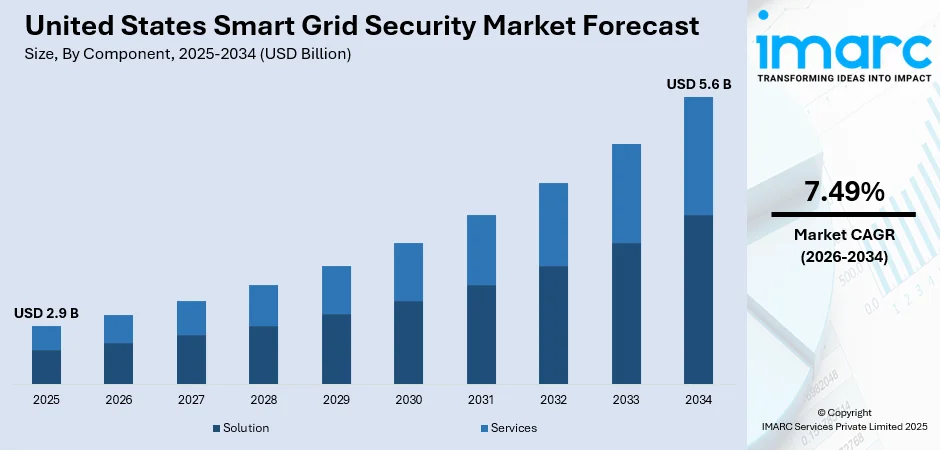
The United States smart grid security market size reached USD 2.9 Billion in 2025. Looking forward, IMARC Group expects the market to reach USD 5.6 Billion by 2034, exhibiting a growth rate (CAGR) of 7.49% during 2026-2034.
|
Report Attribute
|
Key Statistics
|
|---|---|
|
Base Year
|
2025
|
|
Forecast Years
|
2026-2034
|
|
Historical Years
|
2020-2025
|
|
Market Size in 2025
|
USD 2.9 Billion |
|
Market Forecast in 2034
|
USD 5.6 Billion |
| Market Growth Rate (2026-2034) | 7.49% |
Access the full market insights report Request Sample
United States Smart Grid Security Market Insights:
- Major Market Drivers: The major drivers are expanding cyber threats on energy infrastructure, expanding smart meter installations, and strict federal regulations requiring grid protection. These are pushing investments in sophisticated security measures and fueling demand for robust smart grid security platforms.
- Key Market Trends: Adoption of AI-powered anomaly detection, cloud-native security architecture, and focus on endpoint security are among the important trends. These technologies improve real-time threat detection and response, enabling dynamic smart grid operation and enhancing system resilience against changing cyberattack vectors.
- Competitive Landscape: The market is comprised of both established cybersecurity companies and energy-oriented technology vendors that provide bundled software and hardware solutions. Competition is driven by innovation, compliance capacity, and scalability, and vendors compete on customizable, layered security products optimized to address utility and grid operator needs.
- Challenges and Opportunities: Though complexity in securing decentralized networks is an issue, the opportunities are in AI-based security analytics, regulatory compliance offerings, and secure IoT integration. These areas can be utilized by market participants to differentiate their offerings and meet increasing utility requirements for end-to-end grid protection.

To get more information on this market Request Sample
A smart grid security system helps prevent energy frauds and preserves privacy. It also optimizes the infrastructure to regulate the flow of power and meet demands for peak time. A smart grid security system consists of various advanced components and control methods, which are integrated with communication systems to provide improved interfaces used for measurement and sensing. Moreover, it also uses different technological solutions like antivirus, antimalware, firewalls, intrusion detection, identity and access management (IAM), encryption, and data loss prevention (DLP) systems.
The United States smart grid security market is primarily driven by the increase in electricity consumption and power generation. Besides this, the growing cases of cyberattacks have also resulted in the rising adoption of smart grid security systems to secure communications and smart grid deployments. The United States also accounts for the majority of the smart grid projects. Along with this, a rise in the usage of cloud- and web-based applications across the industrial sectors is providing a positive thrust to the market growth. Furthermore, technological advancements, such as the integration of Supervisory Control and Data Acquisition (SCADA) systems and the Internet of Things (IoT), are also contributing to the market growth.
United States Smart Grid Security Market Trends:
Integration of AI and ML in Smart Grid Security Solutions
Artificial intelligence (AI) and machine learning (ML) integration is transforming cyber protection for energy networks. These technologies are identifying threats in real-time by learning from large amounts of data produced by grid systems. Smart grid operators are implementing AI-based monitoring to detect anomalies and automated incident responses. This transition improves reliability and responsiveness while reducing the potential for power disruption. As the utilities focus on modernization, these smart frameworks provide economical scalability and better protection. Additionally, automated AI tools facilitate better compliance with changing regulatory frameworks and cyber requirements. United States smart grid security market size is growing in this context due to increasing digitalization throughout the energy industry. At the same time, United States smart grid security market growth is being fueled by advanced analytics and automation plans. Combined, these technologies form a key stronghold of the United States smart grid security market trends, driving long-term change throughout transmission and distribution networks.
Growth of IoT Devices in Grid Infrastructure
The higher use of Internet of Things (IoT) devices in utility infrastructure has brought new attack vectors for possible cyberattacks, necessitating end-to-end protection models. Smart meters, sensors, and automation hardware now constitute a complex grid system in which communication in real time is vital. The progression puts more pressure on securing endpoints and controlling identity-based threats. Heavy encryption, two-factor authentication, and anomaly detection systems are becoming integral components in contemporary smart grid architectures. As utilities evolve, the United States smart grid security market analysis identifies growing investments in endpoint protection as well as data traffic security. Simultaneously, market forecast indicates steady adoption of network-wide visibility and control. With distributed architecture increasing, these utilities aid in timely detection as well as defense against cyber intrusions. Notably, United States smart grid security market share is impacted by edge security adoption as well as scaling secure connectivity to heterogeneous grid devices.
Increasing Focus on Energy Resilience and Regulatory Compliance
United States smart grid security models are becoming increasingly influenced by changing regulatory requirements and national goals for energy resilience. As agencies make compliance requirements stricter, utilities must invest in security measures that adhere to rigorous operational and information technology defenses. These include encryption, real-time monitoring, audit trails, and secure authentication systems. In addition, protecting vital infrastructure from geopolitical threats has led energy operators to engage with government agencies. The market needs thus correlate directly with risk readiness and resilience requirements. With evolving threats, utility companies are adopting threat intelligence sharing and zero-trust architectures to make systems future-proof. In addition, the United States smart grid security market share is being supported by sustained policy pledges to grid modernization and cyber resilience. According to the sources, in April 2024, the U.S. Department of Energy initiated AI programs such as the $13 million VoltAIc program and PolicyAI LLM to transform the grid and facilitate the deployment of clean energy. Moreover, these trends in regulation support the development and strengthening of the grid, with the governance factor contributing to United States smart grid security market trends.
Key Market Segmentation:
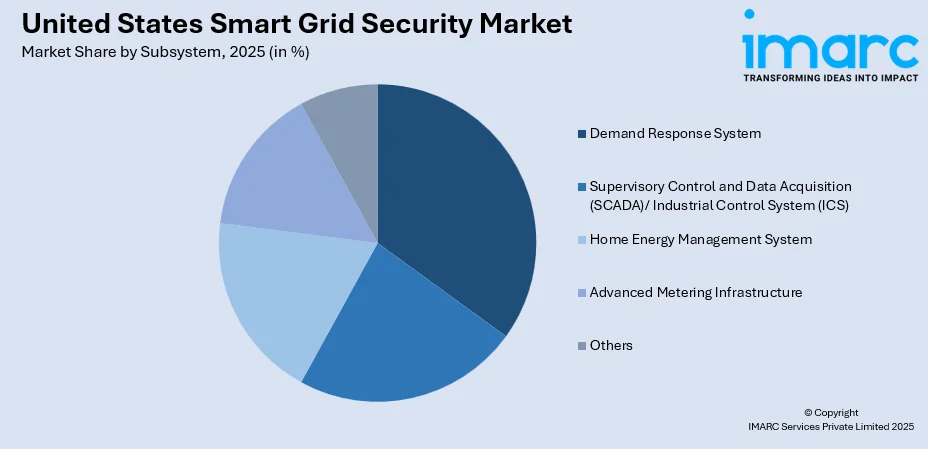
IMARC Group provides an analysis of the key trends in each sub-segment of the United States smart grid security market report, along with forecasts at the country and regional levels from 2026-2034. Our report has categorized the market based on component, subsystem, deployment type and security type.
Breakup by Component:
- Solution
- Encryption
- Antivirus and Antimalware
- Identity and Access Management (IAM)
- Firewall
- Others
- Services
- Managed Services
- Professional Services
- Others
Breakup by Subsystem:

To get detailed segment analysis of this market Request Sample
- Demand Response System
- Supervisory Control and Data Acquisition (SCADA)/ Industrial Control System (ICS)
- Home Energy Management System
- Advanced Metering Infrastructure
- Others
Breakup by Deployment Type:
- Cloud-based
- On-premise
Breakup by Security Type:
- Endpoint Security
- Application Security
- Database Security
- Network Security
- Others
Breakup by Region:
- Northeast
- Midwest
- South
- West
Competitive Landscape:
The competitive landscape of the industry has also been examined along with the profiles of the key players.
Latest News and Developments:
- In March 2025, Verizon Business and Honeywell introduced 5G-connected smart meters in the United States to improve grid reliability. The smart meters provide real-time energy information, remote software updates, and AI-powered utility management, enhancing operational efficiency and minimizing service disruptions throughout the power distribution chain.
- In March 2025, Hitachi Energy and AWS introduced an AI-driven vegetation management solution to increase U.S. grid reliability. By avoiding outages through predictive analytics, the system enhances operational resilience—bolstering the United States smart grid security market with enhanced reliability, cloud integration, and secure, data-driven grid management.
- In March 2025, Schneider Electric released its artificial intelligence-driven One Digital Grid Platform in Dallas, which will help U.S. utilities upgrade infrastructure, enhance grid resiliency, minimize outages, and integrate DERs efficiently—enabling the changing needs of the United States Smart Grid Security Market through secure, flexible, and real-time digital energy solutions.
Report Coverage:
| Report Features | Details |
|---|---|
| Base Year of the Analysis | 2025 |
| Historical Period | 2020-2025 |
| Forecast Period | 2026-2034 |
| Units | Billion USD |
| Segment Coverage | Component, Subsystem, Deployment Type, Security Type, Region |
| Region Covered | Northeast, Midwest, South, West |
| Customization Scope | 10% Free Customization |
| Post-Sale Analyst Support | 10-12 Weeks |
| Delivery Format | PDF and Excel through Email (We can also provide the editable version of the report in PPT/Word format on special request) |
Key Questions Answered in This Report
The smart grid security market in the United States was valued at USD 2.9 Billion in 2025.
The United States smart grid security market is projected to exhibit a CAGR of 7.49% during 2026-2034, reaching a value of USD 5.6 Billion by 2034.
Market drivers of the United States smart grid security market are the expanding use of advanced metering infrastructure (AMI), increasing cyber attacks on critical energy infrastructure, growing deployment of distributed energy resources, and strict government regulations requiring higher levels of cybersecurity throughout utility networks and power distribution systems.
Need more help?
- Speak to our experienced analysts for insights on the current market scenarios.
- Include additional segments and countries to customize the report as per your requirement.
- Gain an unparalleled competitive advantage in your domain by understanding how to utilize the report and positively impacting your operations and revenue.
- For further assistance, please connect with our analysts.
 Request Customization
 Speak to an Analyst
 Request Brochure
 Inquire Before Buying


.webp)


.webp)


