United States SCADA Market Report by Component (Programmable Logic Controller (PLC), Remote Terminal Units (RTU), Human Machine Interface (HMI), Communication Systems, and Others), Architecture (Hardware, Software, Services), End User (Oil and Gas, Power, Water and Wastewater, Manufacturing, Chemicals and Petrochemicals, Pharmaceutical, and Others), and Region 2025-2033
Market Overview:
The United States SCADA market size reached USD 4,873.6 Million in 2024. Looking forward, IMARC Group expects the market to reach USD 6,744.2 Million by 2033, exhibiting a growth rate (CAGR) of 3.49% during 2025-2033.
|
Report Attribute
|
Key Statistics
|
|---|---|
|
Base Year
|
2024
|
|
Forecast Years
|
2025-2033
|
|
Historical Years
|
2019-2024
|
|
Market Size in 2024
|
USD 4,873.6 Million |
|
Market Forecast in 2033
|
USD 6,744.2 Million |
| Market Growth Rate (2025-2033) | 3.49% |
Supervisory control and data acquisition or SCADA is a control framework that uses computers, graphical user interface (UI), and networked data communications for supervisory management at a higher level and obtaining real-time information from topographically isolated areas. It is used across various industries, such as power, pharmaceutical, oil and gas, chemical and petrochemical, automotive and electrical, electronics, and water and wastewater treatment. In the United States, SCADA systems are widely adopted to enhance productivity and efficiency in various industrial processes.
The United States SCADA market is primarily driven by the increasing adoption of SCADA by power operators and service providers. SCADA systems are used for their ability to detect faults in machines and minimize the possible defects quickly. Besides this, there has been a rising demand for SCADA due to its cost-effectiveness. Moreover, the extensive research and development (R&D) activities in wireless sensor networks and the strong presence of prominent electrical SCADA software and system suppliers in the country are also bolstering the growth of the market. Furthermore, SCADA systems improve extraction output, streamlining production, and curbing losses, which are increasing their employment in the oil and gas sector.
Key Market Segmentation:
IMARC Group provides an analysis of the key trends in each sub-segment of the United States SCADA market report, along with forecasts at the country and regional levels from 2025-2033. Our report has categorized the market based on component, architecture and end user.
Breakup by Component:

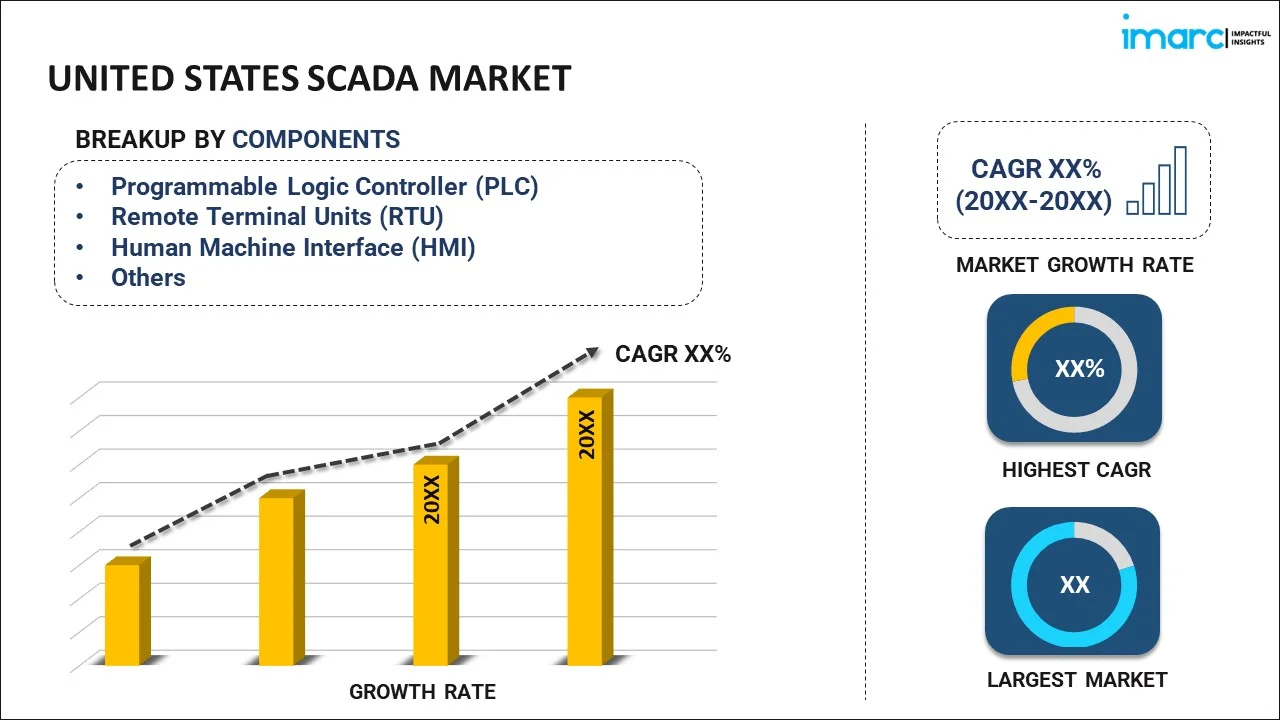
- Programmable Logic Controller (PLC)
- Remote Terminal Units (RTU)
- Human Machine Interface (HMI)
- Communication Systems
- Others
Breakup by Architecture:
- Hardware
- Software
- Services
Breakup by End User:
- Oil and Gas
- Power
- Water and Wastewater
- Manufacturing
- Chemicals and Petrochemicals
- Pharmaceutical
- Others
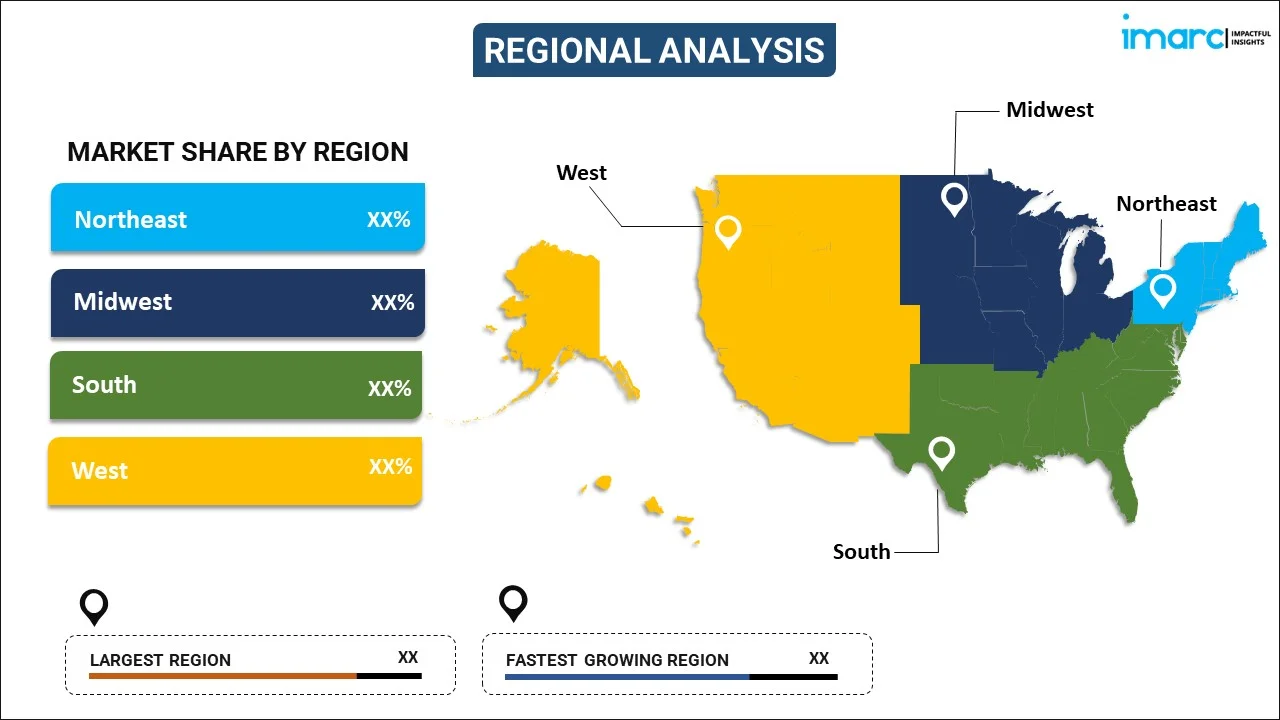
Breakup by Region:

- Northeast
- Midwest
- South
- West
Competitive Landscape:
The competitive landscape of the industry has also been examined along with the profiles of the key players.
Report Coverage:
| Report Features | Details |
|---|---|
| Base Year of the Analysis | 2024 |
| Historical Period | 2019-2024 |
| Forecast Period | 2025-2033 |
| Units | Million USD |
| Segment Coverage | Component, Architecture, End User, Region |
| Region Covered | Northeast, Midwest, South, West |
| Customization Scope | 10% Free Customization |
| Post-Sale Analyst Support | 10-12 Weeks |
| Delivery Format | PDF and Excel through Email (We can also provide the editable version of the report in PPT/Word format on special request) |
Key Questions Answered in This Report:
- How has the United States SCADA market performed so far and how will it perform in the coming years?
- What has been the impact of COVID-19 on the United States SCADA market?
- What are the key regional markets?
- What is the breakup of the market based on the component?
- What is the breakup of the market based on the architecture?
- What is the breakup of the market based on the end user?
- What are the various stages in the value chain of the industry?
- What are the key driving factors and challenges in the industry?
- What is the structure of the United States SCADA market and who are the key players?
- What is the degree of competition in the industry?
Need more help?
- Speak to our experienced analysts for insights on the current market scenarios.
- Include additional segments and countries to customize the report as per your requirement.
- Gain an unparalleled competitive advantage in your domain by understanding how to utilize the report and positively impacting your operations and revenue.
- For further assistance, please connect with our analysts.
 Request Customization
 Speak to an Analyst
 Request Brochure
 Inquire Before Buying


.webp)


.webp)


