
United States Intravenous Solutions Market Size, Share, Trends and Forecast by Type, Nutrients, and Region, 2026-2034
United States Intravenous Solutions Market Summary:
The United States intravenous solutions market size was valued at USD 3,258.10 Million in 2025 and is projected to reach USD 4,321.13 Million by 2034, growing at a compound annual growth rate of 3.19% from 2026-2034.
In the United States, the market is experiencing robust growth, driven by the increasing incidence of chronic diseases, rising surgical procedures, and the expanding geriatric population requiring critical care. The growing demand for parenteral nutrition among patients unable to consume food orally, coupled with advancements in intravenous (IV) therapy technology, is creating a positive market outlook. Additionally, the shift towards home-based infusion services and the development of premixed, multi-chamber IV solutions are enhancing patient convenience and clinical efficiency.
Key Takeaways and Insights:
-
By Type: Total parenteral nutrition dominates the market with a share of 77.7% in 2025, owing to its critical role in providing comprehensive nutritional support directly into the bloodstream for patients who cannot consume food orally or absorb nutrients through their gastrointestinal tract. Rising cases of malnutrition and gastrointestinal disorders are fueling the segment expansion.
-
By Nutrients: Amino acids lead the market with a share of 36.8% in 2025, reflecting their essential role in supporting protein synthesis, wound healing, tissue repair, and overall metabolic function. Growing demand for customized amino acid formulations tailored to specific patient needs is driving adoption across clinical settings.
-
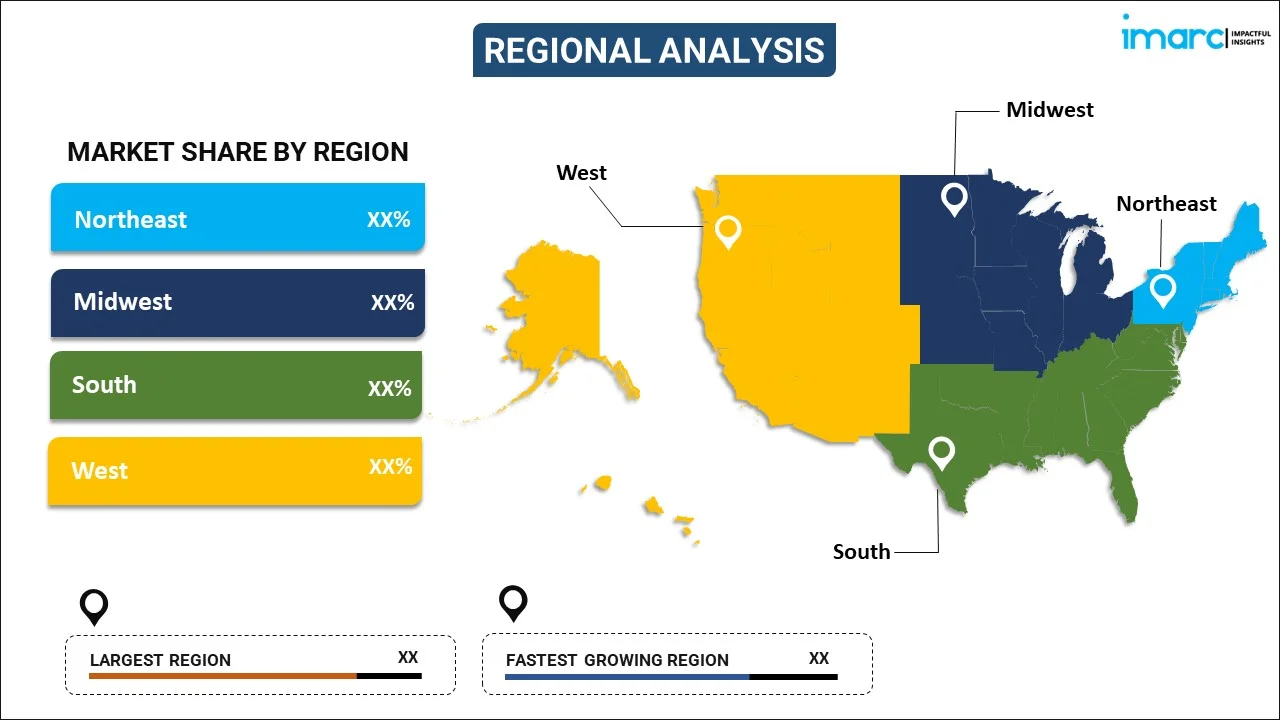
By Region: Northeast prevails the market with a share of 21% in 2025, due to its high concentration of large hospitals, academic medical centers, and specialty care facilities. Strong healthcare infrastructure, advanced treatment adoption, and higher patient volumes drive consistent demand for IV therapies across acute, chronic, and emergency care settings.
-
Key Players: Key players are fueling the market growth by broadening product portfolios, investing in advanced formulations, and strengthening distribution networks. Their focus on innovations, strategic partnerships, and manufacturing capacity expansion ensures consistent product availability and enhances treatment outcomes across diverse healthcare settings.
In the United States, the market is witnessing sustained growth driven by the rising burden of chronic diseases requiring long-term nutritional support and fluid management. The increasing number of surgical procedures necessitating IV fluids for hydration, anesthesia delivery, and post-operative recovery is propelling the market demand. The aging population, which is more susceptible to conditions, such as cancer, diabetes, and renal disorders requiring IV therapy, represents a significant consumer base. As per US Census Bureau, by 2050, the estimated number of Americans aged 65 and above is expected to rise to 82 Million, representing a substantial demographic shift driving healthcare demand. The growing preference for home-based infusion therapy, technological advancements in premixed solutions and infusion devices, and favorable reimbursement frameworks are further accelerating market expansion across the country. The expanding healthcare infrastructure and rising awareness about the benefits of IV therapy are further contributing to the market share.
United States Intravenous Solutions Market Trends:
Expansion of Home-Based Infusion Therapy Services
The shift towards home-based healthcare is transforming the IV solutions landscape, with patients increasingly preferring treatment in comfortable, familiar environments. As per IMARC Group, the United States home healthcare market size reached USD 96.8 Billion in 2024. Home infusion therapy offers advantages, including reduced hospital readmissions, lower infection risks, and improved patient satisfaction. Healthcare providers are expanding their home care programs, particularly for parenteral nutrition, anti-infective therapy, and chronic disease management, enabling patients to receive quality care while maintaining their daily routines.
Advancements in Premixed Multi-Chamber IV Solutions
Premixed multi-chamber IV solutions are gaining substantial traction, as healthcare facilities seek to enhance operational efficiency and reduce medication errors. These ready-to-use formulations eliminate the need for manual compounding, reducing contamination risks and simplifying clinical workflows. Manufacturers are investing in developing advanced multi-chamber bags featuring balanced mixtures of electrolytes, amino acids, lipids, and vitamins manufactured under strict pharmacopoeia standards. The adoption of these solutions is particularly prominent in intensive care units (ICUs) and surgical settings where accurate nutrient delivery and time efficiency are paramount for patient outcomes.
Growing Aging Population and Chronic Disease Burden
The expanding aging population in the United States significantly contributes to the market growth. Elderly patients are more susceptible to chronic conditions, such as kidney disorders, cardiovascular diseases, diabetes, and gastrointestinal issues that often require IV hydration, nutrition, or medication delivery. As per CDC, in 2023, chronic kidney disease (CKD) occurred more frequently in individuals aged 65 and older (34%) compared to those aged 45–64 years (12%) or 18–44 years (6%) in the United States. Older adults also experience higher hospitalization and surgical rates, increasing IV fluid usage during preoperative, operative, and postoperative care. Chronic disease management frequently involves periodic inpatient treatment, boosting long-term demand. Additionally, age-related dehydration risks and reduced oral intake make IV therapy essential in many cases.
Market Outlook 2026-2034:
The United States intravenous solutions market demonstrates promising growth prospects, driven by sustained healthcare demand and technological innovations. The market generated a revenue of USD 3,258.10 Million in 2025 and is projected to reach a revenue of USD 4,321.13 Million by 2034, growing at a compound annual growth rate of 3.19% from 2026-2034. The continued expansion of outpatient and ambulatory care settings, increasing adoption of home infusion services, and ongoing investments in manufacturing infrastructure are expected to drive market momentum. The development of next-generation formulations with enhanced stability and efficacy, combined with strengthening supply chain resilience, will support sustained market expansion throughout the forecast period.
United States Intravenous Solutions Market Report Segmentation:
| Segment Category | Leading Segment | Market Share |
|---|---|---|
| Type | Total Parenteral Nutrition | 77.7% |
| Nutrients | Amino Acids | 36.8% |
| Region | Northeast | 21% |
Breakup by Type:
To get detailed segment analysis of this market, Request Sample
- Partial Parenteral Nutrition
- Total Parenteral Nutrition
Total parenteral nutrition dominates with a market share of 77.7% of the total United States intravenous solutions market in 2025.
Total parenteral nutrition serves as a critical lifeline for patients who cannot receive adequate nutrition through oral or enteral routes due to conditions, such as gastrointestinal disorders, cancer, and severe malnutrition. It delivers a comprehensive mixture of essential nutrients, including amino acids, dextrose, lipids, vitamins, and minerals, directly into the bloodstream through central venous access. The segment's dominance reflects the growing patient population requiring complete nutritional support in ICUs, surgical recovery settings, and long-term care facilities across the country.
The increasing prevalence of chronic conditions affecting nutrient absorption and the rising number of premature births requiring specialized nutritional intervention are driving total parenteral nutrition adoption. The 2024 Report Card, released by March of Dimes, showed that more than 370,000 infants were born prematurely in 2023, with one-third of the largest United States cities earning an F grade for rates of preterm births. Twenty-four states saw deteriorating rates, particularly in the southeastern region, where Black birthing individuals encountered preterm birth rates 1.4 times greater than their counterparts. Healthcare providers continue to invest in total parenteral nutrition programs with enhanced compounding technologies and monitoring systems to optimize patient outcomes while reducing infection risks and metabolic complications.
Nutrients Insights:
- Carbohydrates
- Salts and Electrolytes
- Minerals
- Vitamins
- Amino Acids
Amino acids lead with a share of 36.8% of the total United States intravenous solutions market in 2025.
Amino acids represent the largest nutrient segment due to their fundamental role in protein synthesis, tissue repair, immune function, and metabolic regulation. Single-dose amino acid solutions provide essential building blocks for patients recovering from surgery, trauma, or critical illness who cannot meet protein requirements through conventional feeding methods.
Critically ill, post-surgical, and malnourished patients depend on IV amino acid solutions to maintain nitrogen balance, support tissue repair, and prevent muscle wasting. Their routine use in hospitals ensures consistent demand across intensive care, surgical recovery, and long-term treatment settings. Additionally, the growing need for parenteral nutrition in patients with gastrointestinal disorders, cancer, and severe trauma strengthens amino acid solution consumption. These solutions are widely used in both short-term and long-term nutritional therapy, often combined with glucose and lipid emulsions. Their flexibility in formulation allows tailored patient care, making amino acid-based IV solutions a core component of clinical nutrition practices across the United States.
Breakup by Region:
To get detailed regional analysis of this market, Request Sample
- Northeast
- Midwest
- South
- West
Northeast represents the largest region with a share of 21% of the total United States intravenous solutions market in 2025.
The Northeast leads the United States intravenous solutions market due to its dense network of hospitals, tertiary care centers, and academic medical institutions. In August 2025, New York City Council progressed Lenox Hill Hospital's redevelopment. Health care infrastructure initiatives, such as this one, assist working families while providing essential facilities that various communities require. The region handles high patient inflows for complex procedures, critical care, and specialized treatments that require continuous IV therapy. A higher prevalence of aging population and chronic conditions further increases the need for fluid management, nutrition, and medication delivery through IV solutions, supporting strong and consistent consumption across healthcare facilities.
Additionally, the Northeast benefits from advanced healthcare practices and early adoption of modern treatment protocols. Hospitals in the region emphasize intensive care, surgical interventions, and infection management, which rely heavily on IV fluids. Strong reimbursement systems, skilled medical professionals, and a focus on quality patient outcomes encourage sustained use of IV solutions, reinforcing the region’s leading position in the national market.
Market Dynamics:
Growth Drivers:
Why is the United States Intravenous Solutions Market Growing?
Rising Prevalence of Chronic Diseases Requiring Nutritional Support
The increasing burden of chronic diseases across the United States is significantly driving the demand for IV solutions as essential components of patient care. Conditions, such as cancer, diabetes, renal disorders, and gastrointestinal diseases, often compromise patients' ability to maintain adequate nutrition through conventional oral intake. IV therapy provides critical support for managing these conditions by delivering essential nutrients, medications, and fluids directly into the bloodstream. According to the Centers for Disease Control and Prevention, six in ten adults in the United States had at least one chronic disease in 2023. This substantial disease burden creates sustained demand for IV solutions in both acute care and long-term management settings, as healthcare providers increasingly rely on parenteral nutrition to optimize patient outcomes and prevent malnutrition-related complications.
Increasing Surgical Procedures and Hospital Admissions
The growing volume of surgical procedures across the United States is catalyzing substantial demand for IV solutions essential for perioperative care. As per an annual survey of hospitals in the United States, conducted by the American Hospital Association, total hospital admissions across all United States facilities reached 33,679,935 in 2024. IV fluids play critical roles in preoperative preparation, intraoperative fluid management, anesthesia delivery, and postoperative recovery across virtually all surgical specialties. The expansion of outpatient surgical centers and ambulatory care facilities has broadened the settings where IV therapy is administered. Healthcare infrastructure development continues to increase capacity for surgical services, with hospitals investing in modern operating facilities and enhanced recovery programs requiring sophisticated IV therapy protocols. The rising prevalence of conditions necessitating surgical intervention, combined with advancements in minimally invasive techniques enabling procedures in older and higher-risk patients, sustains demand for IV solutions across the healthcare continuum.
Innovations in technology
Technological advancements are improving safety, efficiency, and treatment precision. Modern manufacturing technologies enable higher sterility assurance, longer shelf life, and consistent quality of IV fluids, increasing trust among healthcare providers. Innovations in packaging, such as ready-to-use and pre-mixed solutions, reduce preparation time and medication errors in hospitals. Advanced infusion pumps and smart delivery systems allow accurate flow control and dosing, supporting wider use of IV therapy across critical and routine care. Digital monitoring and automation help clinicians track patient hydration and electrolyte balance in real time, improving outcomes. Improved compatibility of IV solutions with complex drug therapies also expands their application in oncology and intensive care. As healthcare facilities adopt advanced technologies to enhance patient safety and operational efficiency, reliance on standardized, high-quality IV solutions continues to increase, supporting sustained market growth.
Market Restraints:
What Challenges the United States Intravenous Solutions Market is Facing?
Supply Chain Vulnerabilities and Manufacturing Disruptions
The concentrated nature of IV solutions manufacturing creates vulnerabilities to supply chain disruptions that can significantly impact product availability nationwide. Natural disasters, equipment failures, and facility shutdowns can rapidly create shortages affecting patient care across healthcare settings. Such disruptions require healthcare providers to implement conservation measures, delay elective procedures, and seek alternative supply sources, highlighting the need for strengthened supply chain resilience.
High Costs Associated with IV Therapy and Specialized Formulations
The expenses associated with IV therapy, including specialized equipment, sterile compounding requirements, and skilled nursing support, present challenges for healthcare facilities and patients. Customized parenteral nutrition formulations and advanced multi-chamber solutions command premium pricing that may limit accessibility. Reimbursement complexities and coverage limitations for certain IV therapy services create additional financial barriers affecting adoption across care settings.
Risk of Complications and Infection Concerns
IV therapy carries inherent risks, including catheter-related bloodstream infections, metabolic complications, and fluid imbalances that require careful monitoring and management. These clinical risks necessitate specialized training, stringent adherence to aseptic techniques, and comprehensive patient monitoring protocols. The potential for adverse events influences prescribing practices and drives investment in safety-enhanced devices and formulations to mitigate complications.
Competitive Landscape:
In the United States, the market features a moderately consolidated competitive landscape with established multinational corporations holding significant market positions. Key players compete through product innovations, manufacturing capacity expansion, strategic partnerships, and comprehensive service offerings. Companies are investing substantially in research and development (R&D) activities to introduce advanced formulations, premixed solutions, and safety-enhanced delivery systems. Strategic focus areas include expanding production facilities to strengthen supply chain resilience, developing specialized solutions for therapeutic niches, and enhancing distribution networks to ensure consistent product availability. Market participants increasingly pursue collaborations with healthcare systems and group purchasing organizations to secure long-term contracts and expand market presence across acute care and alternate site settings.
Recent Developments:
-
In October 2025, Celltrion, Inc. declared that the IV formulation of Avtozma (tocilizumab-anoh) was made accessible to patients in the United States. Avtozma IV would be offered in all the same formulations that Actemra IV provided. The accessible formulations were 80 mg/4 mL (20 mg/mL), 200 mg/10 mL (20 mg/mL), and 400 mg/20 mL (20 mg/mL) offered in single-dose vials.
Report Coverage:
| Report Features | Details |
|---|---|
| Base Year of the Analysis | 2025 |
| Historical Period | 2020-2025 |
| Forecast Period | 2026-2034 |
| Units | Million USD |
| Types Covered | Partial Parenteral Nutrition, Total Parenteral Nutrition |
| Nutrients Covered | Carbohydrates, Salts and Electrolytes, Minerals, Vitamins, Amino Acids |
| Regions Covered | Northeast, Midwest, South, West |
| Customization Scope | 10% Free Customization |
| Post-Sale Analyst Support | 10-12 Weeks |
| Delivery Format | PDF and Excel through Email (We can also provide the editable version of the report in PPT/Word format on special request) |
Key Questions Answered in This Report
The United States intravenous solutions market size was valued at USD 3,258.10 Million in 2025.
The United States intravenous solutions market is expected to grow at a compound annual growth rate of 3.19% from 2026-2034 to reach USD 4,321.13 Million by 2034.
Total parenteral nutrition dominated the market with a share of 77.7%, driven by its essential role in providing comprehensive nutritional support for patients unable to consume food through oral or enteral routes.
Key factors driving the United States intravenous solutions market include rising incidence of chronic diseases, expanding geriatric population, increasing surgical procedures, growing adoption of home-based infusion therapy, and technological advancements in IV formulations and delivery systems.
Major challenges include supply chain vulnerabilities and manufacturing concentration risks, high costs associated with specialized IV therapy and customized formulations, risk of catheter-related infections and metabolic complications, and reimbursement complexities affecting treatment accessibility across care settings.
Need more help?
- Speak to our experienced analysts for insights on the current market scenarios.
- Include additional segments and countries to customize the report as per your requirement.
- Gain an unparalleled competitive advantage in your domain by understanding how to utilize the report and positively impacting your operations and revenue.
- For further assistance, please connect with our analysts.
 Request Customization
 Speak to an Analyst
 Request Brochure
 Inquire Before Buying
Benefits of Customization
- Personalize this research
- Triangulate with your data
- Get data as per your format and definition
- Gain a deeper dive into a specific application, geography, customer, or competitor
- Any level of personalization
Get in Touch With Us
UNITED STATES
Phone: +1-201-971-6302
INDIA
Phone: +91-120-433-0800
UNITED KINGDOM
Phone: +44-753-714-6104
Email: sales@imarcgroup.com
Client Testimonials


.webp)


