United States Human Machine Interface Market Report by Component (Hardware, Software, Services), Configuration (Embedded, Standalone), Technology Type (Motion HMI, Bionic HMI, Tactile HMI, Optical HMI, Acoustic HMI), End Use Industry (Packaging, Food and Beverage, Automotive, Pharmaceuticals, Utilities, Metals and Mining, and Others), and Region 2025-2033
Market Overview:
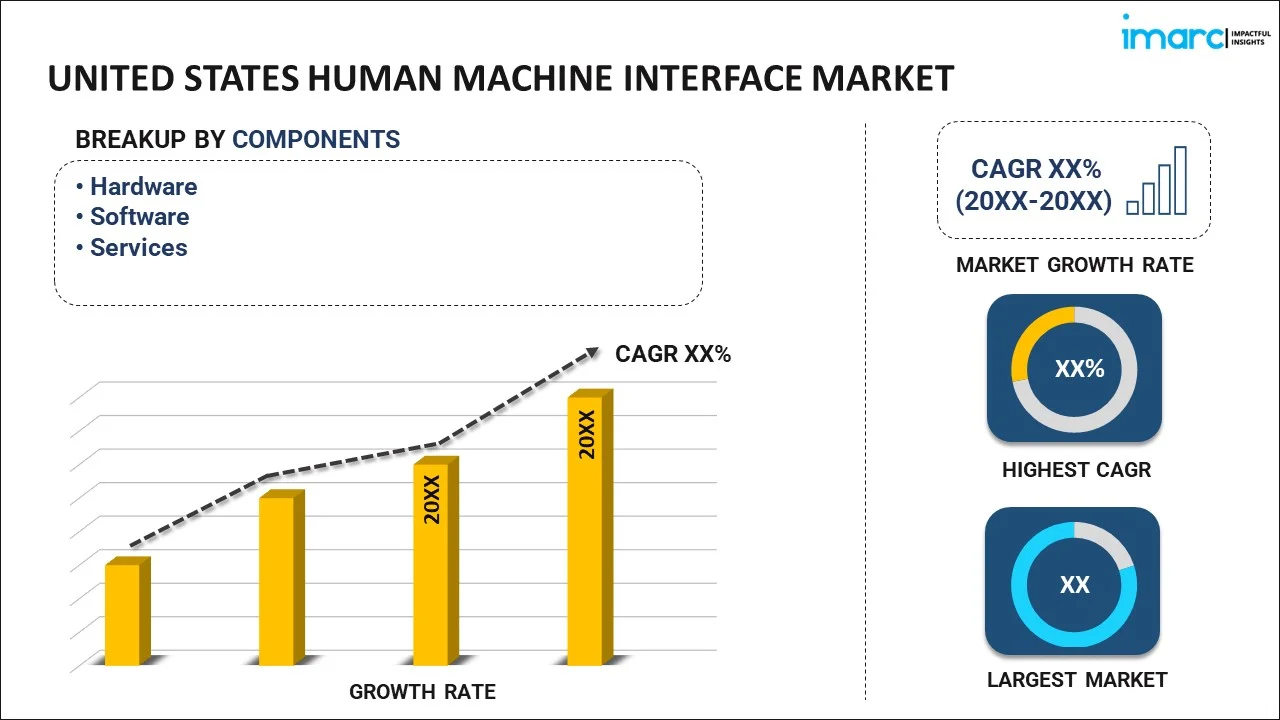
The United States human machine interface market size reached USD 1.7 Billion in 2024. Looking forward, IMARC Group expects the market to reach USD 2.6 Billion by 2033, exhibiting a growth rate (CAGR) of 4.56% during 2025-2033.
|
Report Attribute
|
Key Statistics
|
|---|---|
|
Base Year
|
2024
|
|
Forecast Years
|
2025-2033
|
|
Historical Years
|
2019-2024
|
|
Market Size in 2024
|
USD 1.7 Billion |
|
Market Forecast in 2033
|
USD 2.6 Billion |
| Market Growth Rate 2025-2033 | 4.56% |
A human machine interface (HMI) is a dashboard used to efficiently communicate and interact with the machine. It comprises devices, such as motion sensors, peripheral devices and speech-recognition interfaces, which help share information using sound, sight and touch. It also assists in reducing errors, increasing user satisfaction and enhancing overall productivity. Consequently, it finds extensive applications in portable handheld devices, centralized control rooms, factory floor machines, building automation, digital signage and vending machines in the United States.
Advancements in multimodal HMI solutions that allow users to operate different functions of automobiles using the touch screen, haptic feedback, and gesture and voice control, along with the escalating demand for self-driving cars in the United States, are among the key factors impelling the market growth. Moreover, the increasing trend of protocol conversion for exchanging data between connected devices is contributing to the market growth. Apart from this, HMI systems are widely adopted in the healthcare industry as they help speed up recovery and improve patient monitoring. Additionally, these systems are designed with an easy to clean surface and anti-microbial materials, which are helping in minimizing the risk of cross-contamination.
Key Market Segmentation:
IMARC Group provides an analysis of the key trends in each segment of the United States human machine interface market report, along with forecasts at the country and regional levels from 2025-2033. Our report has categorized the market based on component, configuration, technology type and end use industry.
Breakup by Component:

- Hardware
- Basic HMI
- Advanced Panel-Based HMI
- Advanced PC-Based HMI
- Software
- On-Premise HMI
- Advanced Panel-Based HMI
- Advanced PC-Based HMI
- Services
Breakup by Configuration:
- Embedded
- Standalone
Breakup by Technology Type:
- Motion HMI
- Bionic HMI
- Tactile HMI
- Optical HMI
- Acoustic HMI
Breakup by End Use Industry:
- Packaging
- Food and Beverage
- Automotive
- Pharmaceuticals
- Utilities
- Metals and Mining
- Others
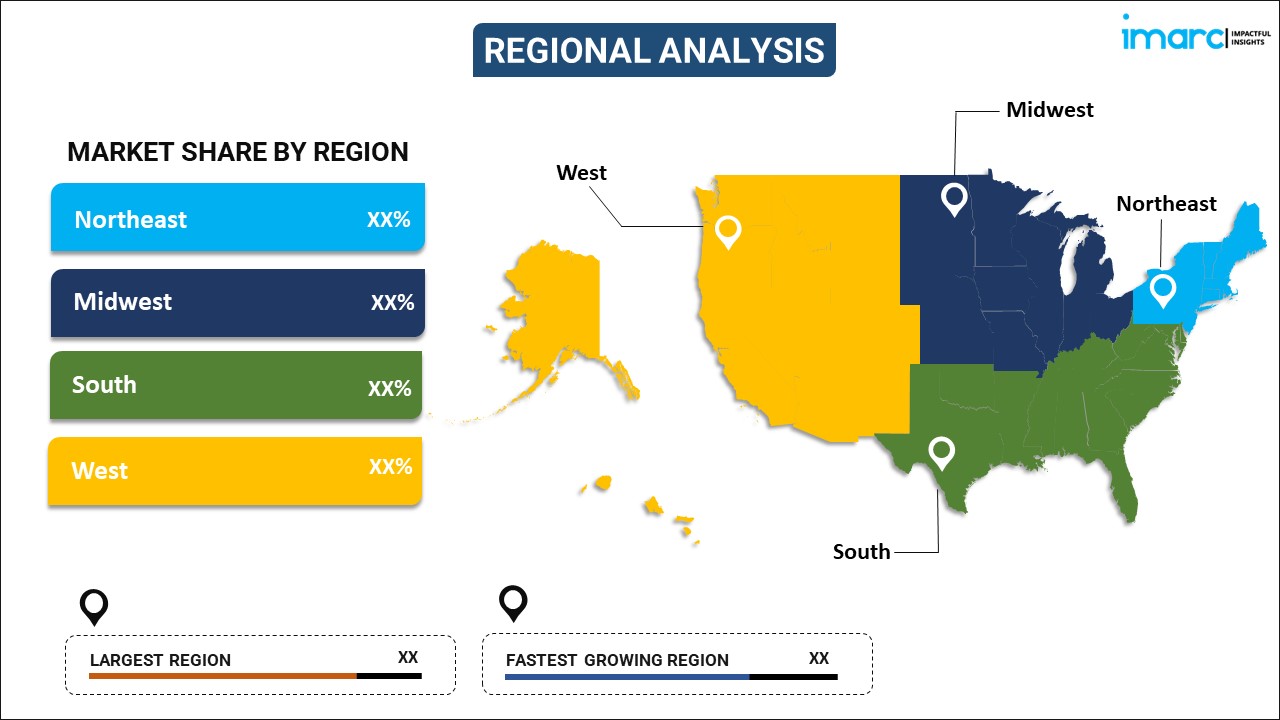
Breakup by Region:

- Northeast
- Midwest
- South
- West
Competitive Landscape:
The competitive landscape of the industry has also been examined along with the profiles of the key players.
Report Coverage:
| Report Features | Details |
|---|---|
| Base Year of the Analysis | 2024 |
| Historical Period | 2019-2024 |
| Forecast Period | 2025-2033 |
| Units | Billion USD |
| Segment Coverage | Component, Configuration, Technology Type, End Use Industry, Region |
| Region Covered | Northeast, Midwest, South, West |
| Customization Scope | 10% Free Customization |
| Post-Sale Analyst Support | 10-12 Weeks |
| Delivery Format | PDF and Excel through Email (We can also provide the editable version of the report in PPT/Word format on special request) |
Key Questions Answered in This Report:
- How has the United States human machine interface market performed so far and how will it perform in the coming years?
- What has been the impact of COVID-19 on the United States human machine interface market?
- What are the key regional markets?
- What is the breakup of the market based on the component?
- What is the breakup of the market based on the configuration?
- What is the breakup of the market based on the technology type?
- What is the breakup of the market based on the end use industry?
- What are the various stages in the value chain of the industry?
- What are the key driving factors and challenges in the industry?
- What is the structure of the United States human machine interface market and who are the key players?
- What is the degree of competition in the industry?
Need more help?
- Speak to our experienced analysts for insights on the current market scenarios.
- Include additional segments and countries to customize the report as per your requirement.
- Gain an unparalleled competitive advantage in your domain by understanding how to utilize the report and positively impacting your operations and revenue.
- For further assistance, please connect with our analysts.
 Request Customization
 Speak to an Analyst
 Request Brochure
 Inquire Before Buying


.webp)


.webp)


