United States Gold Nanoparticles Market Report by Type (Water Soluble, Oil Soluble, and Others), Application (Imaging, Targeted Drug Delivery, Sensors, In Vitro Diagnostics, Probes, Catalysis, and Others), End Use Industry (Electronics, Healthcare, Chemicals, and Others), and Region 2025-2033
Market Overview:
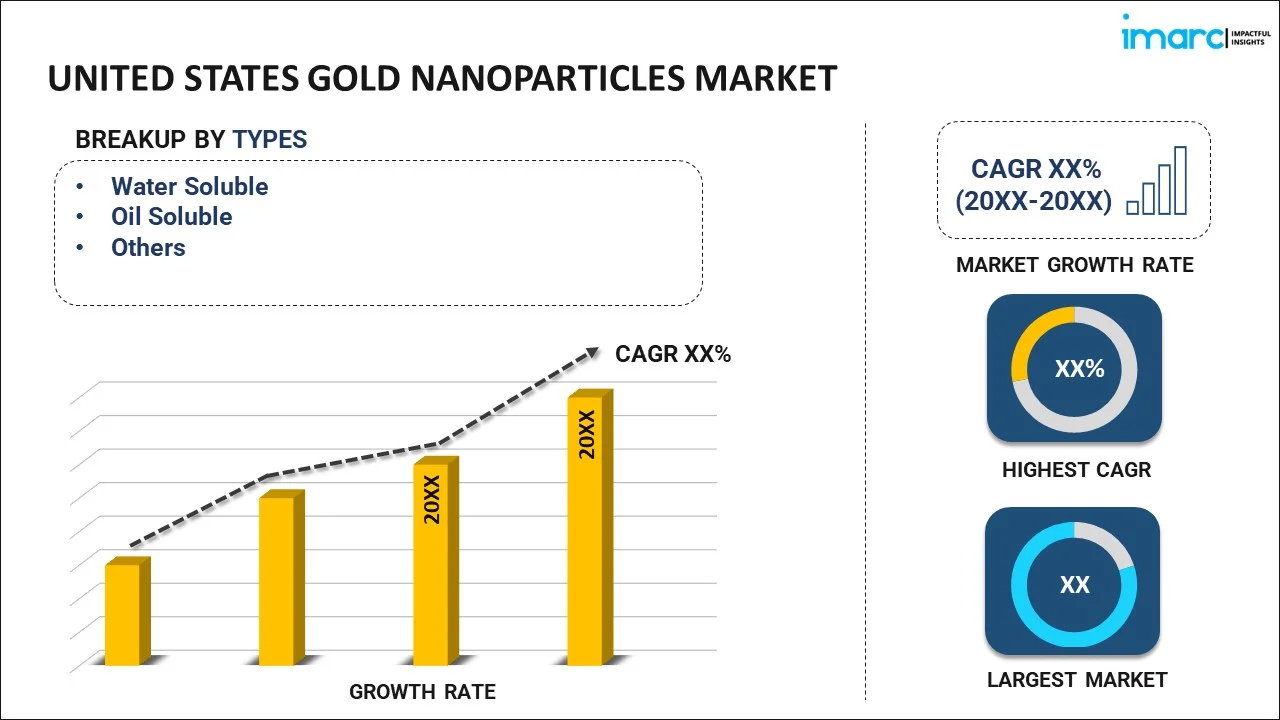
The United States gold nanoparticles market size reached USD 1,705.4 Million in 2024. Looking forward, IMARC Group expects the market to reach USD 3,544.3 Million by 2033, exhibiting a growth rate (CAGR) of 8.04% during 2025-2033.
|
Report Attribute
|
Key Statistics
|
|---|---|
|
Base Year
|
2024
|
|
Forecast Years
|
2025-2033
|
|
Historical Years
|
2019-2024
|
|
Market Size in 2024
|
USD 1,705.4 Million |
|
Market Forecast in 2033
|
USD 3,544.3 Million |
| Market Growth Rate (2025-2033) | 8.04% |
Gold nanoparticles (AuNPs) refer to gold particles with a diameter between 1 to 100 nanometers. They have high electron conductivity, stability and solubility. They are manufactured in the form of nanosphere, nanocages, nanorods, nanoshells, nanocubes and nanoclusters. Gold nanoparticles find extensive applications in targeted drug administration and as agents in the delivery of biomolecules. They are also used in optical imaging probes that utilize them for the detection of biomarkers of various diseases in imaging procedures like positron emission tomography (PET), computed tomography (CT), magnetic resonance imaging (MRI) and ultrasound scans.
The United States gold nanoparticles market is primarily driven by the growing advancements in the healthcare sector. For instance, gold nanoparticles are widely used in cancer imaging and therapeutic procedures. The rising adoption of gold nanoparticles in photothermal therapy and coating titanium dental implants for osteoinduction is also propelling the growth of the market. Additionally, extensive expenditure in the research and development (R&D) activities for targeted oncological treatment, along with the high precision printing and photovoltaic products based on gold nanoparticles, are also providing a significant impact on the market.
Key Market Segmentation:
IMARC Group provides an analysis of the key trends in each segment of the United States gold nanoparticles market report, along with forecasts at the country and regional levels from 2025-2033. Our report has categorized the market based on type, application and end use industry.
Breakup by Type:

- Water Soluble
- Oil Soluble
- Others
Breakup by Application:
- Imaging
- Targeted Drug Delivery
- Sensors
- In Vitro Diagnostics
- Probes
- Catalysis
- Others
Breakup by End Use Industry:
- Electronics
- Healthcare
- Chemicals
- Others
Breakup by Region:

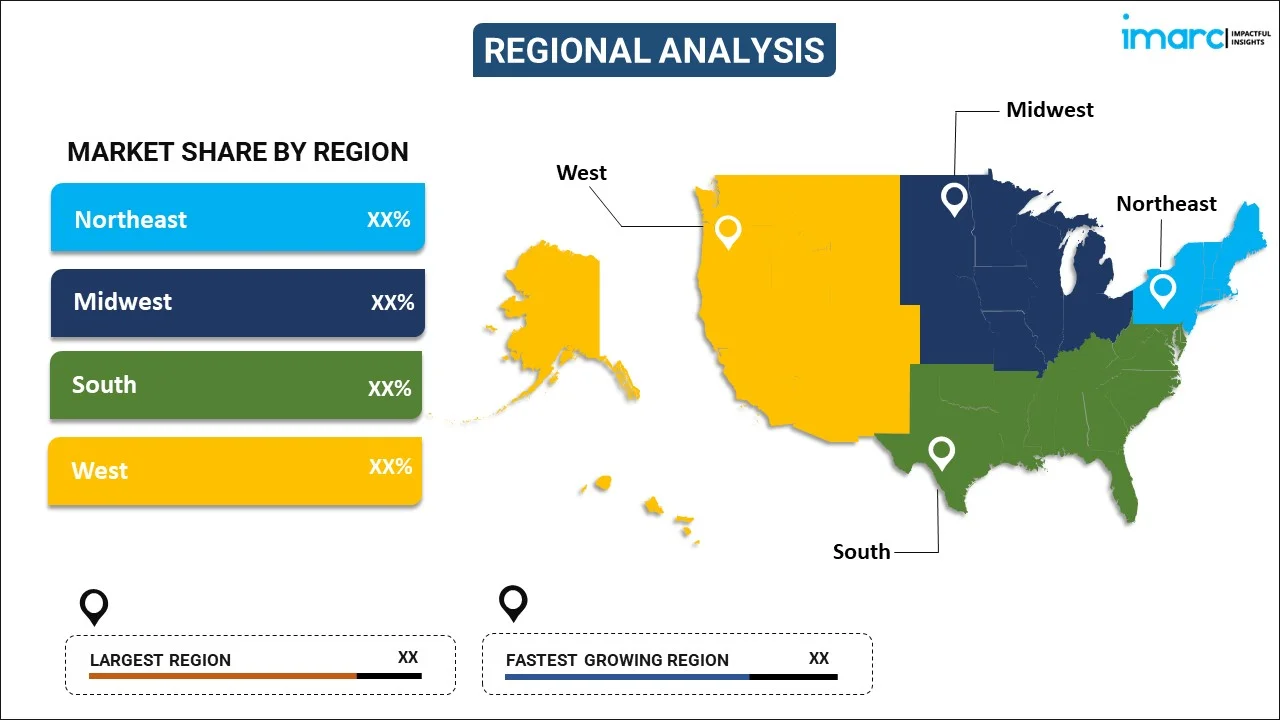
- Northeast
- Midwest
- South
- West
Competitive Landscape:
The competitive landscape of the industry has also been examined along with the profiles of the key players.
Report Coverage:
| Report Features | Details |
|---|---|
| Base Year of the Analysis | 2024 |
| Historical Period | 2019-2024 |
| Forecast Period | 2025-2033 |
| Units | Million USD |
| Segment Coverage | Type, Application, End Use Industry, Region |
| Region Covered | Northeast, Midwest, South, West |
| Customization Scope | 10% Free Customization |
| Post-Sale Analyst Support | 10-12 Weeks |
| Delivery Format | PDF and Excel through Email (We can also provide the editable version of the report in PPT/Word format on special request) |
Key Questions Answered in This Report:
- How has the United States gold nanoparticles market performed so far and how will it perform in the coming years?
- What has been the impact of COVID-19 on the United States gold nanoparticles market?
- What are the key regional markets?
- What is the breakup of the market based on the type?
- What is the breakup of the market based on the application?
- What is the breakup of the market based on the end use industry?
- What are the various stages in the value chain of the industry?
- What are the key driving factors and challenges in the industry?
- What is the structure of the United States gold nanoparticles market and who are the key players?
- What is the degree of competition in the industry?
Need more help?
- Speak to our experienced analysts for insights on the current market scenarios.
- Include additional segments and countries to customize the report as per your requirement.
- Gain an unparalleled competitive advantage in your domain by understanding how to utilize the report and positively impacting your operations and revenue.
- For further assistance, please connect with our analysts.
 Request Customization
 Speak to an Analyst
 Request Brochure
 Inquire Before Buying


.webp)


.webp)


