
United States Gaming Peripherals Market Size, Share, Trends, and Forecast by Product Type, Gaming Device Type, Technology, Distribution Channel, and Region, 2025-2033
United States Gaming Peripherals Market Size and Share:
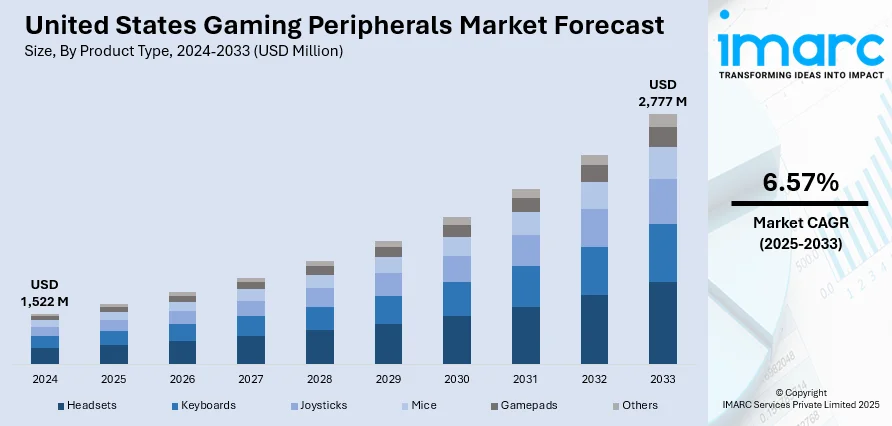
The United States gaming peripherals market size was valued at USD 1,522 Million in 2024. Looking forward, the market is expected to reach USD 2,777 Million by 2033, exhibiting a CAGR of 6.57% during 2025-2033. West currently dominates the market, holding a significant market share in 2024. The market is expanding steadily, driven by rising demand for immersive gaming experiences, increasing popularity of eSports, and technological advancements in hardware. Consumers seek high-performance accessories, such as gaming mice, keyboards, headsets, and controllers, which is also escalating the product demand. Enhanced PC and console gaming culture continues to support this growth, contributing to the overall increase in the United States gaming peripherals market share.
|
Report Attribute
|
Key Statistics
|
|---|---|
|
Base Year
|
2024
|
|
Forecast Years
|
2025-2033
|
|
Historical Years
|
2019-2024
|
|
Market Size in 2024
|
USD 1,522 Million |
|
Market Forecast in 2033
|
USD 2,777 Million |
| Market Growth Rate 2025-2033 | 6.57% |
The increasing popularity of eSports and competitive gaming has significantly boosted demand for high-performance peripherals. For instance, in August 2023, USA-based Glorious Gaming, a prominent lifestyle gaming brand, officially entered the Indian market, aiming to transform how players experience gaming. Known for its premium, professional-grade products, the company seeks to redefine the gaming hardware landscape by offering a range of accessories, including keyboards, mice, and mousepads, that blend high performance, top-tier quality, and stylish design at accessible prices. Professional and amateur gamers alike are investing in advanced accessories such as mechanical keyboards, precision mice, high-fidelity headsets, and customizable controllers to gain a competitive edge and improve gameplay.
To get more information on this market, Request Sample
The United States gaming peripherals market growth is also driven by the rapid growth of the gaming community, especially among younger demographics, which is creating a larger consumer base. With the advent of multiplayer online gaming, streaming, such as Twitch and YouTube Gaming, and the convergence of gaming into normal entertainment, peripherals have grown more important to offer immersive and socially interactive experiences in gaming. Technical innovation in gaming devices is spearheading the increase in the market. Brands are building ergonomically crafted and feature-loaded devices with a better tactile system, programmable buttons, RGB backlight, and wireless support. These innovations cater to both casual and hardcore gamers who value performance and personalization. For instance, in January 2024, ROG expanded its product lineup with a range of impressive new additions to kick off 2024. The latest releases include high-performance mechanical gaming keyboards, top-tier gaming mice, immersive headsets, and even a specially designed backpack for gamers.
United States Gaming Peripherals Market Trends:
Expanding Gaming Population and E-Sports Participation
One of the key factors driving the US gaming peripherals market is the rising number of both hardcore and casual gamers. An industry report states that 61% of the U.S. population now plays video games for at least an hour each week, showcasing the vast and growing base of active gamers. This surge in gaming engagement directly translates to higher demand for advanced peripherals like controllers, keyboards, headsets, and gaming mice. Additionally, the growing popularity of e-sports further propels the market. With 3,530 active esports players in the U.S., the demand for professional-grade gaming accessories is rising steadily, encouraging manufacturers to innovate and cater to competitive as well as recreational users.
Shift Toward Cloud Gaming and VR Experiences
The increasing acceptance of cloud-based gaming solutions is significantly influencing the US gaming peripherals market. Cloud platforms eliminate the need for constant hardware upgrades while enabling high-performance gaming, which in turn boosts the demand for adaptable and cloud-compatible accessories. According to the United States gaming peripherals market trends, the COVID-19 pandemic accelerated indoor entertainment, fueling interest in virtual reality (VR) and e-sports. As a result, gaming accessories that enhance immersive experiences, such as VR headsets, motion controllers, and specialized input devices, have seen rising adoption. The evolving preference for more dynamic and accessible gameplay environments continues to open new opportunities for peripheral manufacturers across the country.
Demand for High-Quality, Immersive Hardware
As gamers increasingly seek immersive and lifelike experiences, the demand for superior hardware has grown considerably. According to the United States gaming peripherals market forecast, this includes advanced gaming consoles, high-resolution displays, full-body motion sensors, and precision-engineered peripherals designed to deliver seamless interaction and realism. Manufacturers are responding by developing cutting-edge accessories that complement evolving gaming platforms. At the same time, the presence of strong copyright protections for PC games helps maintain a stable and regulated market environment, encouraging further investment and innovation. Together, these factors reinforce the growing appeal of high-end gaming gear and bolster the broader market for gaming peripherals in the United States.
United States Gaming Peripherals Industry Segmentation:
IMARC Group provides an analysis of the key trends in each segment of the United States gaming peripherals market, along with forecasts at the country and regional levels from 2025-2033. The market has been categorized based on product type, gaming device type, technology, and distribution channel.
Analysis by Product Type:
- Headsets
- Keyboards
- Joysticks
- Mice
- Gamepads
- Others
Headsets stand as the largest product type in 2024, holding 33.3% of the market due to their essential role in delivering immersive audio experiences and enabling real-time communication during gameplay. As multiplayer and online gaming continue to grow, clear in-game communication has become a priority, making headsets a critical accessory for both casual and competitive players. High-quality headsets enhance spatial awareness, sound effects, and voice clarity, contributing to better performance and engagement. Additionally, the rise of streaming, podcasting, and content creation further drives demand for premium headsets with built-in microphones. Brands continuously innovate with features like noise cancellation, wireless connectivity, and surround sound, appealing to a wide range of gamers. These factors make headsets the most widely adopted peripheral in the US market.
Analysis by Gaming Device Type:
- PC (Desktop/Laptop)
- Gaming Consoles
Gaming consoles electronics leads the market with 60.0% of market share in 2024 due to their widespread adoption and strong user base across all age groups. Popular platforms like PlayStation, Xbox, and Nintendo Switch have created a massive ecosystem that drives consistent demand for compatible peripherals such as controllers, headsets, charging docks, and custom accessories. Console gaming offers a user-friendly, plug-and-play experience, making it highly accessible to casual and family-oriented gamers. Exclusive game titles and frequent product upgrades also contribute to the need for updated peripherals, which is further creating a positive United States gaming peripherals market outlook. Additionally, with strong brand loyalty and a focus on multiplayer and online gaming, users increasingly invest in high-quality accessories to enhance performance and immersion, further strengthening the dominance of console-based peripherals in the US market.
Analysis by Technology:
- Wired
- Wireless
Wireless stand as the largest component in 2024, holding 58.8% of the market. Wireless technology holds the largest share in the United States gaming peripherals market due to its convenience, improved performance, and growing consumer preference for clutter-free setups. Modern wireless peripherals now offer low-latency connections and long battery life, making them ideal for both casual and competitive gaming. Gamers appreciate the flexibility and mobility wireless devices provide, especially in multi-functional gaming and workspaces. The advancement of Bluetooth and proprietary wireless protocols has minimized lag, once a major drawback. Additionally, sleek and minimalistic designs enabled by wireless technology appeal to style-conscious users. As more gamers seek a clean, cable-free environment without compromising performance, wireless keyboards, mice, and headsets have become the preferred choice, leading to their dominance in the US market.
Analysis by Distribution Channel:
- Online
- Offline
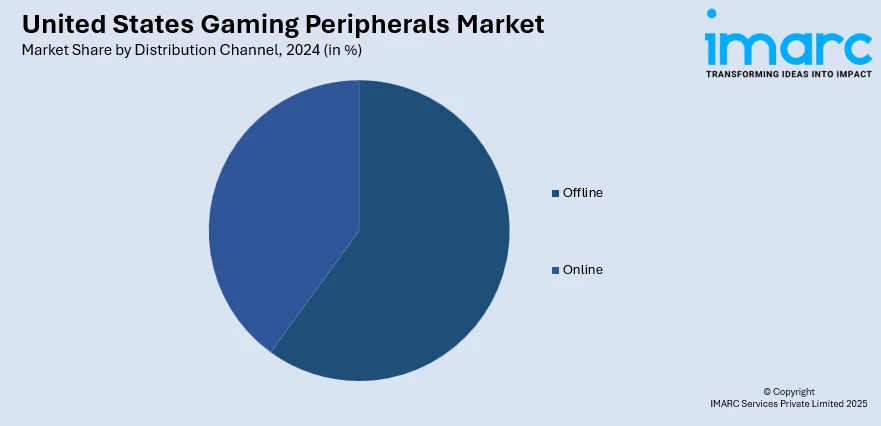
Offline leads the market with 60.6% of market share in 2024 due to the strong consumer preference for hands-on experience before purchase. Physical retail stores allow gamers to test and compare the feel, responsiveness, and build quality of products like keyboards, mice, and headsets. This is especially important for serious and professional gamers who value tactile feedback and ergonomics. Additionally, offline stores offer immediate product availability, personalized assistance, and after-sales support, which enhances customer trust and satisfaction. Major electronics retailers, specialty gaming stores, and brand outlets create a reliable network for direct purchases. In-store promotions, bundled deals, and exclusive launches also attract buyers, reinforcing the dominance of offline sales in the US gaming peripherals market.
Regional Analysis:
- Northeast
- Midwest
- South
- West
In the West, the United States gaming peripherals market demand is driven by a strong tech-savvy population and a high concentration of eSports events, gaming conventions, and tech startups. Cities like San Francisco, Seattle, and Los Angeles host major gaming studios and competitive tournaments, fueling demand for high-performance accessories. The widespread adoption of PC and console gaming, along with growing interest in streaming and content creation, further boosts sales of gaming keyboards, mice, headsets, and webcams. Additionally, the region’s access to early technological innovations and higher disposable incomes encourages consumers to invest in premium peripherals. The increasing popularity of VR gaming and cloud-based platforms also contributes to the steady growth of gaming hardware demand in the Western US market.
Competitive Landscape:
The United States gaming peripherals market is highly competitive, dominated by key players such as Logitech G, Razer, Corsair, SteelSeries, and HyperX. These brands compete aggressively through continuous innovation, product diversification, and strong brand loyalty. Logitech G leads with reliable wireless technology and performance-driven devices, while Razer focuses on premium aesthetics and immersive experiences through its Chroma RGB and HyperSpeed wireless features. Corsair leverages its acquisitions of Elgato and SCUF to offer a broader ecosystem for gamers and streamers. SteelSeries and HyperX are popular for their ergonomic designs and affordability, particularly among eSports enthusiasts. Companies gain market edge through partnerships, influencer marketing, and retail presence, while frequent product updates and limited-edition releases help maintain consumer interest and market share.
The report provides a comprehensive analysis of the competitive landscape in the United States gaming peripherals market with detailed profiles of all major companies.
Latest News and Developments:
- June 2025: ASUS ROG unveiled the ROG Xbox Ally and Ally X handhelds, developed with Xbox to blend console and PC gaming. Featuring ergonomic design, Xbox-optimized software, and AMD Ryzen Z2 processors, the devices delivered enhanced performance, comfort, and all-day playability, targeting U.S. gamers ahead of the holiday season.
- May 2025: DXRacer appointed CS: GO legend kennyS as its first Global Brand Ambassador and launched the Martian-Pro Series Electric Gaming Chair. The chair featured motorized adjustments, intelligent ventilation, and massage functions, marking a fusion of esports legacy and innovation in premium ergonomic gaming gear for U.S. consumers.
- January 2025: Nintendo unveiled the Switch 2, featuring a larger hybrid design, backward compatibility, and enhanced performance. Though pricing remained undisclosed, a new Mario Kart game was teased. Experiential launch events, including hands-on demos in New York, Los Angeles, and Dallas, amplified anticipation among U.S. gamers.
- January 2025: Lenovo unveiled its expanded Legion ecosystem, including handhelds like the Legion Go S and Go prototype, redesigned Legion Pro laptops, and powerful gaming towers. These devices featured OLED displays, AI-powered software, and SteamOS integration, offering U.S. gamers advanced performance, immersive experiences, and enhanced peripheral connectivity options.
United States Gaming Peripherals Market Report Scope:
| Report Features | Details |
|---|---|
| Base Year of the Analysis | 2024 |
| Historical Period | 2019-2024 |
| Forecast Period | 2025-2033 |
| Units | Million USD |
| Scope of the Report |
Exploration of Historical Trends and Market Outlook, Industry Catalysts and Challenges, Segment-Wise Historical and Future Market Assessment:
|
| Product Types Covered | Headsets, Keyboards, Joysticks, Mice, Gamepads, Others |
| Gaming Device Types Covered | PC (Desktop/Laptop), Gaming Consoles |
| Technologies Covered | Wired, Wireless |
| Distribution Channels Covered | Online, Offline |
| Regions Covered | Northeast, Midwest, South, West |
| Customization Scope | 10% Free Customization |
| Post-Sale Analyst Support | 10-12 Weeks |
| Delivery Format | PDF and Excel through Email (We can also provide the editable version of the report in PPT/Word format on special request) |
Key Benefits for Stakeholders:
- IMARC’s report offers a comprehensive quantitative analysis of various market segments, historical and current market trends, market forecasts, and dynamics of the United States gaming peripherals market from 2019-2033.
- The research study provides the latest information on the market drivers, challenges, and opportunities in the United States gaming peripherals market.
- Porter's Five Forces analysis assists stakeholders in assessing the impact of new entrants, competitive rivalry, supplier power, buyer power, and the threat of substitution. It helps stakeholders to analyze the level of competition within the United States gaming peripherals industry and its attractiveness.
- Competitive landscape allows stakeholders to understand their competitive environment and provides an insight into the current positions of key players in the market.
Key Questions Answered in This Report
The gaming peripherals market in the United States was valued at USD 1,522 Million in 2024.
The United States gaming peripherals market is projected to exhibit a CAGR of 6.57% during 2025-2033, reaching a value of USD 2,777 Million by 2033.
The United States gaming peripherals market is driven by the rising number of gamers, the growing popularity of eSports and VR, advancements in gaming hardware, and increased demand for immersive experiences. Cloud gaming, higher disposable income, and strong offline retail presence further contribute to the market's consistent growth and innovation.
West currently dominates the United States gaming peripherals market due to a tech-savvy population, strong presence of gaming companies, frequent eSports events, and high demand for advanced, immersive gaming hardware.
Need more help?
- Speak to our experienced analysts for insights on the current market scenarios.
- Include additional segments and countries to customize the report as per your requirement.
- Gain an unparalleled competitive advantage in your domain by understanding how to utilize the report and positively impacting your operations and revenue.
- For further assistance, please connect with our analysts.
 Request Customization
 Speak to an Analyst
 Request Brochure
 Inquire Before Buying
Benefits of Customization
- Personalize this research
- Triangulate with your data
- Get data as per your format and definition
- Gain a deeper dive into a specific application, geography, customer, or competitor
- Any level of personalization
Get in Touch With Us
UNITED STATES
Phone: +1-201-971-6302
INDIA
Phone: +91-120-433-0800
UNITED KINGDOM
Phone: +44-753-714-6104
Email: sales@imarcgroup.com
Client Testimonials


.webp)


