
United States Electric Insulator Market Report by Material (Ceramic/Porcelain, Glass, Composites, and Others), Voltage (Low, Medium, High), Category (Bushings, Other Insulators), Installation (Distribution Networks, Transmission Lines, Substations, Railways, and Others), Product (Pin Insulator, Suspension Insulator, Shackle Insulator, and Others), Rating (<11 kV, 11 kV, 22 kV, 33 kV, 72.5 kV, 145 kV, and Others), Application (Transformer, Cable, Switchgear, Busbar, Surge Protection Device, and Others), End Use Industry (Utilities, Industries, and Others), and Region 2026-2034
Market Overview:
The United States electric insulator market size reached USD 3,581.4 Million in 2025. Looking forward, IMARC Group expects the market to reach USD 5,197.2 Million by 2034, exhibiting a growth rate (CAGR) of 4.22% during 2026-2034.
|
Report Attribute
|
Key Statistics
|
|---|---|
|
Base Year
|
2025
|
|
Forecast Years
|
2026-2034
|
|
Historical Years
|
2020-2025
|
| Market Size in 2025 | USD 3,581.4 Million |
| Market Forecast in 2034 | USD 5,197.2 Million |
| Market Growth Rate (2026-2034) | 4.22% |
Access the full market insights report Request Sample
An electric insulator is a material with high resistivity and low electrical conductivity used to stop the flow of electrical current. It is also used in electrical circuits, which lowers damage to properties and lives in case of mishaps. Ceramic, glass, wood, silk, paper, wood, rubber, and plastic are some of the most commonly used electric insulating material. They are useful for coating wires and distributing electric networks and act as dielectrics in capacitors.
The United States electric insulator market is primarily driven by the growing awareness and the increasing international pressure to lower greenhouse gas emissions, which have resulted in the shift toward the adoption of renewable energy sources. The rising investments to refurbish the aging grid infrastructure has prompted the country to upgrade the network, which is expected to create a positive outlook for the market. For instance, American Electric Power, a US retail energy provider, has invested approximately US$ 9 Billion between the 2017-2019 in-state transmission system to modernize the design standards for improving efficiency and strengthening grid infrastructure. Furthermore, the growth in electricity transmission and distribution (T&D) networks is also catalyzing the growth of the market.
Key Market Segmentation:
IMARC Group provides an analysis of the key trends in each segment of the United States electric insulator market report, along with forecasts at the country and regional levels from 2026-2034. Our report has categorized the market based on material, voltage, category, installation, product, rating, application and end use industry.
Breakup by Material:
To get detailed segment analysis of this market Request Sample
- Ceramic/Porcelain
- Glass
- Composites
- Others
Breakup by Voltage:
- Low
- Medium
- High
Breakup by Category:
- Bushings
- Other Insulators
Breakup by Installation:
- Distribution Networks
- Transmission Lines
- Substations
- Railways
- Others
Breakup by Product:
- Pin Insulator
- Suspension Insulator
- Shackle Insulator
- Others
Breakup by Rating:
- <11 kV
- 11 kV
- 22 kV
- 33 kV
- 72.5 kV
- 145 kV
- Others
Breakup by Application:
- Transformer
- Cable
- Switchgear
- Busbar
- Surge Protection Device
- Others
Breakup by End Use Industry:
- Utilities
- Industries
- Others
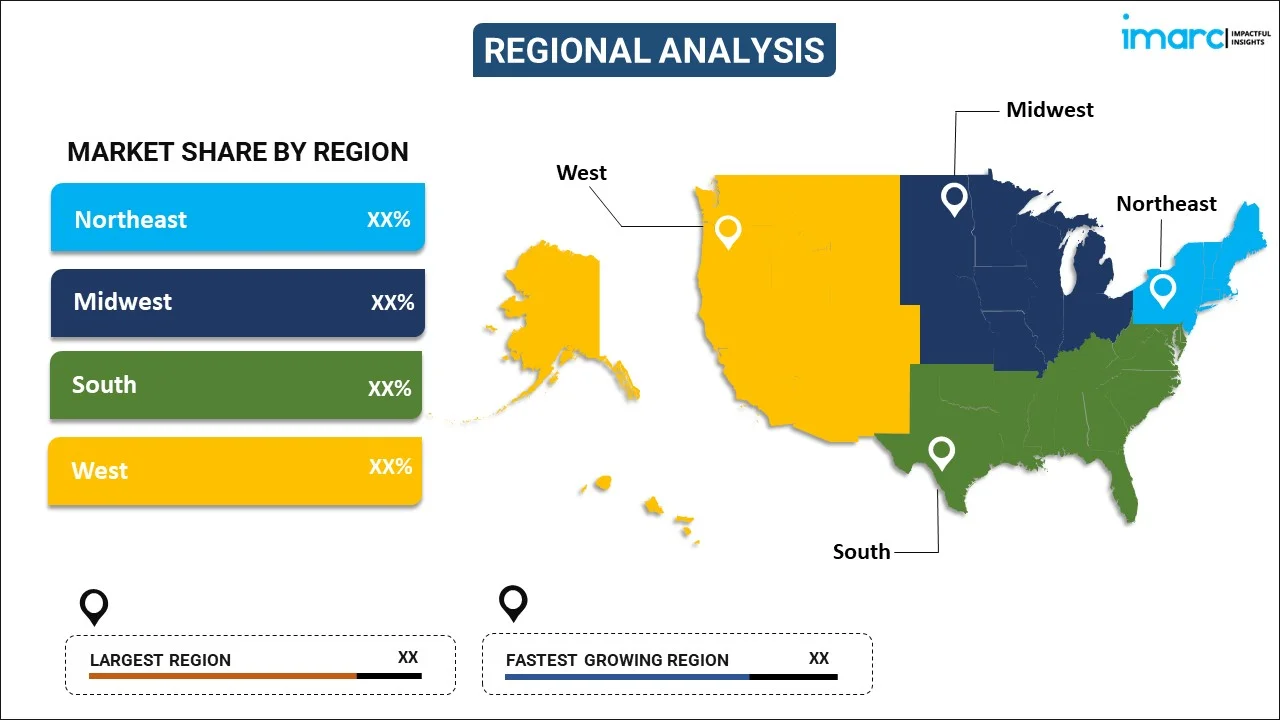
Breakup by Region:
To get detailed regional analysis of this market Request Sample
- Northeast
- Midwest
- South
- West
Competitive Landscape:
The competitive landscape of the industry has also been examined along with the profiles of the key players.
Report Coverage:
| Report Features | Details |
|---|---|
| Base Year of the Analysis | 2025 |
| Historical Period | 2020-2025 |
| Forecast Period | 2026-2034 |
| Units | Million USD |
| Segment Coverage | Material, Voltage, Category, Installation, Product, Rating, Application, End Use Industry, Region |
| Region Covered | Northeast, Midwest, South, West |
| Customization Scope | 10% Free Customization |
| Post-Sale Analyst Support | 10-12 Weeks |
| Delivery Format | PDF and Excel through Email (We can also provide the editable version of the report in PPT/Word format on special request) |
Key Questions Answered in This Report:
- How has the United States electric insulator market performed so far and how will it perform in the coming years?
- What are the key regional markets?
- What is the breakup of the market based on the material?
- What is the breakup of the market based on the voltage?
- What is the breakup of the market based on the category?
- What is the breakup of the market based on the installation?
- What is the breakup of the market based on the product?
- What is the breakup of the market based on the rating?
- What is the breakup of the market based on the application?
- What is the breakup of the market based on the end use industry?
- What are the various stages in the value chain of the industry?
- What are the key driving factors and challenges in the industry?
- What is the structure of the United States electric insulator market and who are the key players?
- What is the degree of competition in the industry?
Need more help?
- Speak to our experienced analysts for insights on the current market scenarios.
- Include additional segments and countries to customize the report as per your requirement.
- Gain an unparalleled competitive advantage in your domain by understanding how to utilize the report and positively impacting your operations and revenue.
- For further assistance, please connect with our analysts.
 Request Customization
 Speak to an Analyst
 Request Brochure
 Inquire Before Buying
Benefits of Customization
- Personalize this research
- Triangulate with your data
- Get data as per your format and definition
- Gain a deeper dive into a specific application, geography, customer, or competitor
- Any level of personalization
Get in Touch With Us
UNITED STATES
Phone: +1-201-971-6302
INDIA
Phone: +91-120-433-0800
UNITED KINGDOM
Phone: +44-753-714-6104
Email: sales@imarcgroup.com
Client Testimonials


.webp)


