United States Digital Asset Management Market Report by Type (Brand Asset Management System, Library Asset Management System, Production Asset Management System), Component (Solution, Services), Application (Sales and Marketing, Broadcast and Publishing, and Others), Deployment (On-premises, Cloud), Organization Size (Small and Medium-sized Enterprises, Large Enterprises), End Use Sector (Media and Entertainment, Banking, Financial Services and Insurance (BFSI), Retail, Manufacturing, Healthcare and Life Sciences, Education, Travel and Tourism, and Others), and Region 2026-2034
Market Overview:
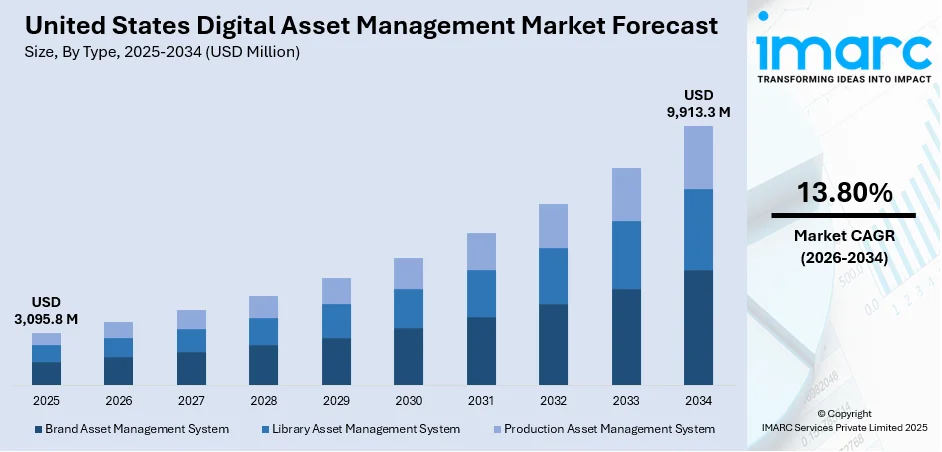
The United States digital asset management market size reached USD 3,095.8 Million in 2025. Looking forward, IMARC Group expects the market to reach USD 9,913.3 Million by 2034, exhibiting a growth rate (CAGR) of 13.80% during 2026-2034.
|
Report Attribute
|
Key Statistics
|
|---|---|
|
Base Year
|
2025
|
|
Forecast Years
|
2026-2034
|
|
Historical Years
|
2020-2025
|
|
Market Size in 2025
|
USD 3,095.8 Million |
|
Market Forecast in 2034
|
USD 9,913.3 Million |
| Market Growth Rate (2026-2034) | 13.80% |
Access the full market insights report Request Sample
United States Digital Asset Management Market Analysis:
- Key Market Drivers: United States digital asset management market demand is mainly driven by the accelerating growth of digital content creation in industries. Organizations increasingly see the necessity of centralizing asset repositories to handle increasing amounts of multimedia content. Improved artificial intelligence (AI) capabilities facilitate automated tagging and smart search features, leading to mass adoption.
- Key Market Trends: Modern management solutions are undergoing major change with AI-driven automation and enhanced search functionality. Companies are focusing on mobile-friendly platforms that enable cross-departmental collaboration and real-time sharing of assets. The market share keeps growing with advanced workflow automation and customized user experience tailored for enterprise-level scalability.
- Competitive Landscape: The competitive landscape reflects established tech leaders and innovative startups providing niche solutions. Key players emphasize rich feature sets, high levels of integration capabilities, and enterprise-class security mechanisms. United States digital asset management market analysis provides evidence of mounting focus on customer success programs, unlimited user models, and price transparency that fosters organizational growth.
- Opportunities and Challenges: Implementation difficulty and adoption continue to be top concerns, necessitating wide-ranging training initiatives and change management tactics. Companies are struggling to integrate traditional systems with contemporary DAM platforms while maintaining data security and compliance needs. Large opportunities await in new markets such as healthcare, education, and manufacturing.

To get more information on this market Request Sample
Digital asset management (DAM) is a software-based solution that is used by organizations for storing, retrieving, and utilizing digital assets like data files, engineering blueprints, text documents, audios, videos and graphics. It authorizes the users to retrieve, review, edit, and share data that is passed through a centralized interface. DAM is also used to automate workflow while managing permissions through various copyright functionalities and streamlining the cloud experience of users. In the United States, DAM has gained prominence as it helps in creating digital content either by encoding it through image, text scanning or digital audio recording and producing it in a digital format.
The United States digital asset management market is primarily driven by the expanding media and entertainment sector due to the high penetration of the internet and social media platforms in the region. Besides this, several vendors have developed DAM solutions and analytics due to excessive content generation. They also offer customized tools to consumers to improve the user experience and expand their market presence. Some of the other factors, such as the integration of artificial intelligence (AI), extensive research and development (R&D) in the field of IT and the emerging trend of digitization, are also propelling the growth of the market.
United States Digital Asset Management Market Trends:
Rising Adoption of Cloud-Based Solutions
The US market for digital asset management is experiencing tremendous growth as a result of the increased use of cloud-based technology. Organizations are moving away from on-premises solutions and embracing cloud platforms to increase scalability, security, and accessibility of digital assets. Cloud-based digital asset management enables companies to automate content processes, enhance collaboration among distributed teams, and reduce storage expenses. The growing need for smooth integration with marketing, creative, and enterprise resource planning (ERP) applications is also propelling adoption. Companies in various industries, such as media, retail, healthcare, and financial services, are increasingly using cloud solutions to store, organize, and distribute digital content cost-effectively. In addition, the functionality to leverage artificial intelligence (AI) and machine learning (ML) features on cloud platforms, including automated tagging, metadata creation, and predictive content analysis, is increasing operational efficiency. Consequently, the United States digital asset management market growth is expected to grow at a high rate during the forecast period.
Increased Need for AI-Based Asset Management
Artificial intelligence is changing the way organizations manage digital assets, with predictive analytics, intelligent tagging, and automated content curation becoming core elements. US-based companies are increasingly turning to AI-based digital asset management systems to enhance business efficiency, search functionality, and marketing campaign optimization. AI-based technologies empower companies to automatically categorize, tag, and handle large amounts of multimedia content with minimal manual intervention and error. In addition, machine learning models assist in forecasting asset performance, user engagement analysis, and personal content recommendation, further solidifying digital marketing strategies. AI combined with cloud storage further facilitates easier access, security, and regulatory compliance for assets. Increasing needs for effective management of digital content in media, entertainment, and e-commerce sectors are driving technological adoption. Therefore, United States digital asset management market growth is experiencing a boost as companies are looking for smart, data-driven solutions to remain competitive in the digital world.
Regulatory Compliance and Security Focus
As more and more data breaches have been on the rise, and regulations around data privacy have tightened, organizations are placing greater importance on secure and compliant digital asset management. Digital asset management platforms now include sophisticated security measures, encryption, access control, and audit trails to meet regulations like HIPAA, GDPR, and CCPA. Business enterprises in the healthcare, finance, and government sectors of the United States are especially intent on reducing risks related to sensitive digital information. Secure storage, managed sharing, and observation of digital content are emerging as top priorities, as well as centralized management systems that make it easier to enforce consistent policy across different departments. Organizations are also making compliance-oriented features an investment, such as automated retention schedules, rights management, and reporting capabilities, to minimize the potential for legal fines and damage to reputation. These advances are increasing confidence in digital asset platforms and promoting uptake among risk-averse industries. Consequently, the United States digital asset management market share is increasing due to the demand for security, regulatory requirements, and effective digital asset governance.
Key Market Segmentation:
IMARC Group provides an analysis of the key trends in each segment of the United States digital asset management market report, along with forecasts at the country and regional levels from 2026-2034. Our report has categorized the market based on type, component, application, deployment, organization size, and end use sector.
Breakup by Type:
- Brand Asset Management System
- Library Asset Management System
- Production Asset Management System
Breakup by Component:
- Solution
- Services
- Consulting
- System Integration
- Support and Maintenance
Breakup by Application:

To get detailed segment analysis of this market Request Sample
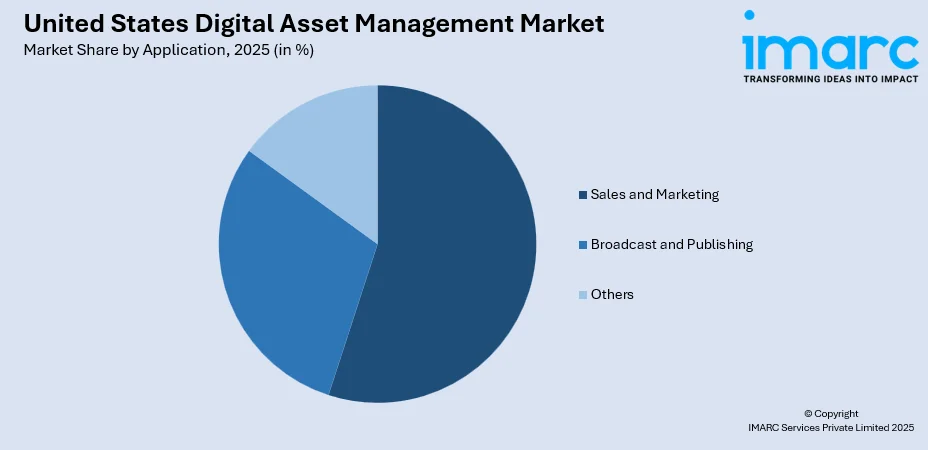
- Sales and Marketing
- Broadcast and Publishing
- Others
Breakup by Deployment:
- On-premises
- Cloud
Breakup by Organization Size:
- Small and Medium-sized Enterprises
- Large Enterprises
Breakup by End Use Sector:
- Media and Entertainment
- Banking, Financial Services and Insurance (BFSI)
- Retail
- Manufacturing
- Healthcare and Life Sciences
- Education
- Travel and Tourism
- Others
Breakup by Region:
- Northeast
- Midwest
- South
- West
Competitive Landscape:
The competitive landscape of the industry has also been examined along with the profiles of the key players.
United States Digital Asset Management Market News:
- September 2025: Anthony Scaramucci and Hivemind Capital launched AVAX One, a pioneering crypto treasury firm. The company plans to raise $550 million from external investors to acquire AVAX tokens and tokenize traditional financial assets on the Avalanche blockchain, marking a first-of-its-kind initiative in the U.S. digital asset sector.
- September 2025: U.S. crypto custody startup BitGo filed for an initial public offering, revealing a nearly fourfold revenue increase in the first half of the year. The strong performance highlights growing investor interest in digital asset services and marks a notable milestone in the United States digital asset management market.
- September 2025: Amber International Holding Limited, under its brand Amber Premium, expanded into the Digital Assets Treasury (DAT) sector by launching institutional-grade digital asset management services. The initiative aims to provide comprehensive solutions for corporate clients, including custody, trading, compliance, and risk management, enhancing the United States digital asset management market.
Report Coverage:
| Report Features | Details |
|---|---|
| Base Year of the Analysis | 2025 |
| Historical Period | 2020-2025 |
| Forecast Period | 2026-2034 |
| Units | Million USD |
| Segment Coverage | Type, Component, Application, Deployment, Organization Size, End Use Sector, Region |
| Region Covered | Northeast, Midwest, South, West |
| Customization Scope | 10% Free Customization |
| Post-Sale Analyst Support | 10-12 Weeks |
| Delivery Format | PDF and Excel through Email (We can also provide the editable version of the report in PPT/Word format on special request) |
Key Questions Answered in This Report
The digital asset management market in the United States was valued at USD 3,095.8 Million in 2025.
The United States digital asset management market is projected to exhibit a CAGR of 13.80% during 2026-2034, reaching a value of USD 9,913.3 Million by 2034.
The market is driven by expanding media and entertainment sectors, high internet penetration, excessive content generation requiring centralized management, artificial intelligence integration enabling automated workflows, extensive IT research and development activities, and emerging digitization trends across industries requiring sophisticated asset management capabilities.
Need more help?
- Speak to our experienced analysts for insights on the current market scenarios.
- Include additional segments and countries to customize the report as per your requirement.
- Gain an unparalleled competitive advantage in your domain by understanding how to utilize the report and positively impacting your operations and revenue.
- For further assistance, please connect with our analysts.
 Request Customization
 Speak to an Analyst
 Request Brochure
 Inquire Before Buying


.webp)


.webp)


