
United States Computational Fluid Dynamics Market Report by Deployment Model (Cloud-Based Model, On-Premises Model), End User (Automotive, Aerospace and Defense, Electrical and Electronics, Industrial Machinery, Energy, Material and Chemical Processing, and Others), and Region 2026-2034
Market Overview:
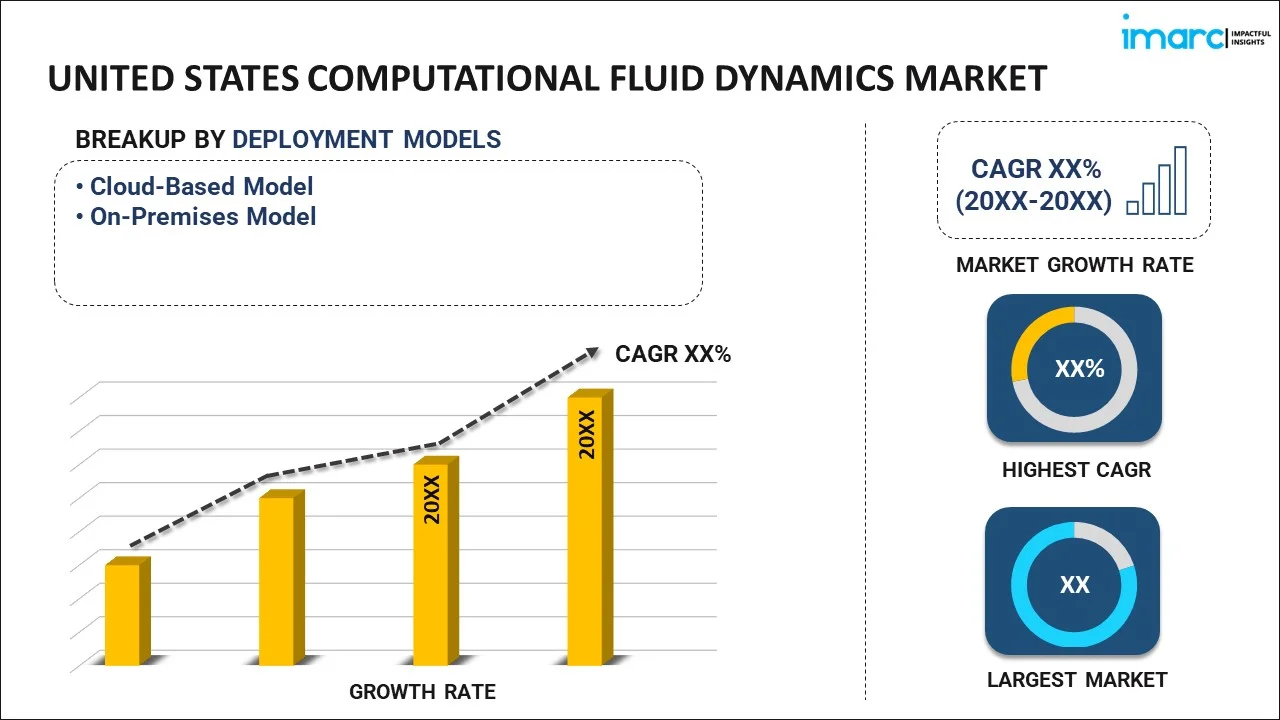
The United States computational fluid dynamics market size reached USD 1,018.7 Million in 2025. Looking forward, IMARC Group expects the market to reach USD 1,807.7 Million by 2034, exhibiting a growth rate (CAGR) of 6.25% during 2026-2034.
|
Report Attribute
|
Key Statistics
|
|---|---|
|
Base Year
|
2025
|
|
Forecast Years
|
2026-2034
|
|
Historical Years
|
2020-2025
|
|
Market Size in 2025
|
USD 1,018.7 Million |
|
Market Forecast in 2034
|
USD 1,807.7 Million |
| Market Growth Rate 2026-2034 | 6.25% |
Access the full market insights report Request Sample
Computational fluid dynamics (CFD) is a branch of fluid mechanics that numerically analyzes fluid flow, heat transfer, and other phenomena. It depends on mathematics, applied physics and computational software to visualize the effects of a gas or liquid on the object it flows past. CFD technology supports manufacturers in decreasing product development and testing duration. It also reduces overall analysis time and offers reliable and cost-effective end products.
The United States CFD market is primarily driven by the increasing number of data centers in the region due to the rapid development of cloud services. This has led to the use of CFD for thermal modeling and creating 3D views of cold air movement that provide cooling in the data center racks. The market is further propelled by the utilization of CFD in the aeronautics industry, wherein it is used to optimize engine cooling and fuel delivery systems. CFD also forms an integral part of the engineering analysis and design environment in various organizations. Furthermore, the rising expenditure in research and development (R&D) activities across the aerospace and military sectors is significantly impacting the market growth.
Key Market Segmentation:
IMARC Group provides an analysis of the key trends in each sub-segment of the United States computational fluid dynamics market report, along with forecasts at the country and regional level from 2026-2034. Our report has categorized the market based on deployment model and end user.
Breakup by Deployment Model:
To get detailed segment analysis of this market Request Sample
- Cloud-Based Model
- On-Premises Model
Breakup by End User:
- Automotive
- Aerospace and Defense
- Electrical and Electronics
- Industrial Machinery
- Energy
- Material and Chemical Processing
- Others
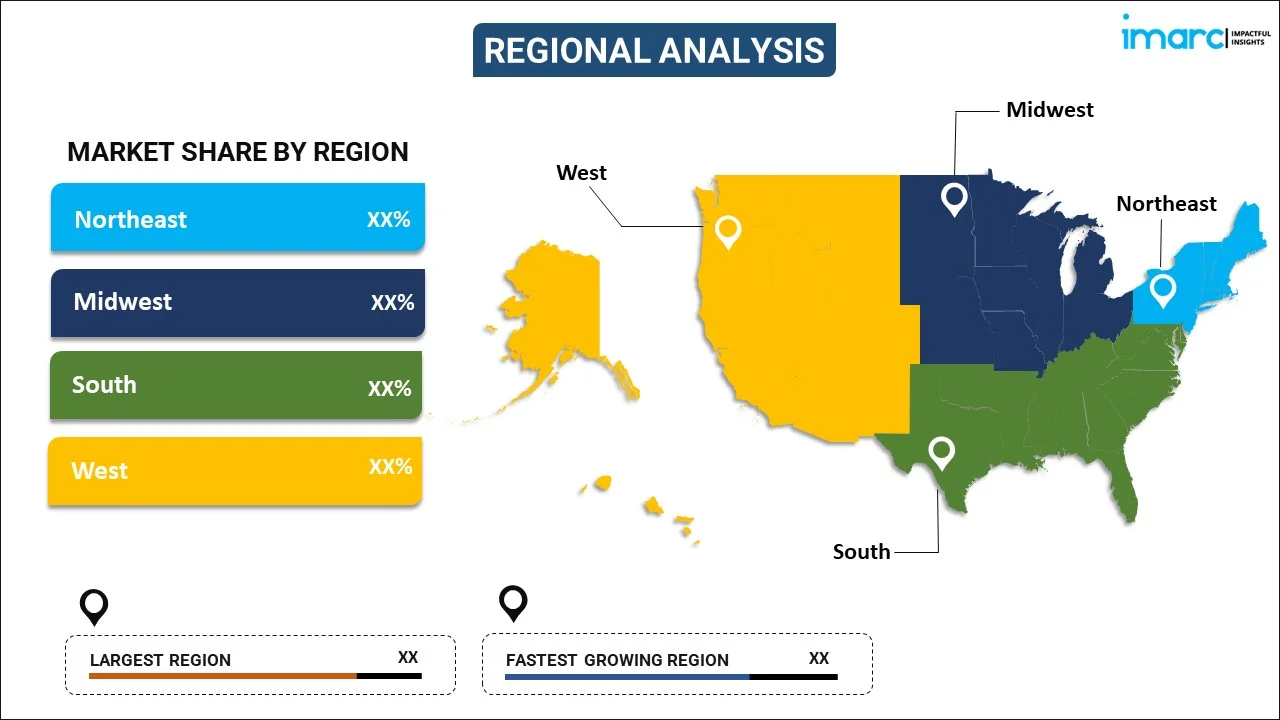
Breakup by Region:
To get detailed regional analysis of this market Request Sample
- Northeast
- Midwest
- South
- West
Competitive Landscape:
The competitive landscape of the industry has also been examined along with the profiles of the key players.
Report Coverage:
| Report Features | Details |
|---|---|
| Base Year of the Analysis | 2025 |
| Historical Period | 2020-2025 |
| Forecast Period | 2026-2034 |
| Units | Million USD |
|
Scope of the Report
|
Exploration of Historical and Forecast Trends, Industry Catalysts and Challenges, Segment-Wise Historical and Predictive Market Assessment:
|
| Deployment Models Covered | Cloud-Based Model, On-Premises Model |
| End Users Covered | Automotive, Aerospace and Defense, Electrical and Electronics, Industrial Machinery, Energy, Material and Chemical Processing, Others |
| Regions Covered | Northeast, Midwest, South, West |
| Customization Scope | 10% Free Customization |
| Post-Sale Analyst Support | 10-12 Weeks |
| Delivery Format | PDF and Excel through Email (We can also provide the editable version of the report in PPT/Word format on special request) |
Key Questions Answered in This Report:
- How has the United States computational fluid dynamics market performed so far and how will it perform in the coming years?
- What has been the impact of COVID-19 on the United States computational fluid dynamics market?
- What are the key regional markets?
- What is the breakup of the market based on the deployment model?
- What is the breakup of the market based on the end user?
- What are the various stages in the value chain of the industry?
- What are the key driving factors and challenges in the industry?
- What is the structure of the United States computational fluid dynamics market and who are the key players?
- What is the degree of competition in the industry?
Need more help?
- Speak to our experienced analysts for insights on the current market scenarios.
- Include additional segments and countries to customize the report as per your requirement.
- Gain an unparalleled competitive advantage in your domain by understanding how to utilize the report and positively impacting your operations and revenue.
- For further assistance, please connect with our analysts.
 Request Customization
 Speak to an Analyst
 Request Brochure
 Inquire Before Buying
Benefits of Customization
- Personalize this research
- Triangulate with your data
- Get data as per your format and definition
- Gain a deeper dive into a specific application, geography, customer, or competitor
- Any level of personalization
Get in Touch With Us
UNITED STATES
Phone: +1-201-971-6302
INDIA
Phone: +91-120-433-0800
UNITED KINGDOM
Phone: +44-753-714-6104
Email: sales@imarcgroup.com
Client Testimonials


.webp)


