
United States Busbar Market Report by Power Rating (High, Medium, Low), Conductor (Copper, Aluminium), End User (Industrial, Commercial, Residential, Utilities), Industry (Chemicals and Petroleum, Metals and Mining, Manufacturing, and Others), and Region 2025-2033
Market Overview:
The United States busbar market size reached USD 4,315.9 Million in 2024. Looking forward, IMARC Group expects the market to reach USD 7,420.8 Million by 2033, exhibiting a growth rate (CAGR) of 5.9% during 2025-2033. The market is witnessing consistent growth as a result of soaring demand for efficient, safe, and compact power distribution systems for commercial, industrial, and utility applications. Smart grid infrastructure developments, growth in renewable energy deployment, and focus on sustainable building practices are adding to the market growth. Moreover, modular design flexibility and high energy efficiency make busbars a choice of preference compared to traditional wiring techniques, increasing competitiveness and United States busbar market share on a global front.
|
Report Attribute
|
Key Statistics
|
|---|---|
|
Base Year
|
2024
|
|
Forecast Years
|
2025-2033
|
|
Historical Years
|
2019-2024
|
|
Market Size in 2024
|
USD 4,315.9 Million |
|
Market Forecast in 2033
|
USD 7,420.8 Million |
| Market Growth Rate 2025-2033 | 5.9% |
United States Busbar Market Analysis:
- Major Market Drivers: The United States busbar market is dominated by increasing demand for effective power delivery systems, increased investments in smart grids, and growing renewable energy projects that need compact, low-loss, and scalable electrical infrastructure.
- Key Market Trends: Major trends encompass the generic acceptance of busbar systems in modular form, increasing use of aluminum-based conductors, and incorporation of IoT-integrated monitoring in busbar networks to improve safety, diagnostics, and performance for industrial and utility customers.
- Competitive Landscape: The market is dominated by both local and foreign manufacturers with emphasis on product development, strategic alliances, and expansion into high-growth markets such as data centers and charging stations for electric vehicles to achieve competitive edge and consolidate market position.
- Challenges and Opportunities: The challenges are high upfront installation expenses and intricate retrofitting within vintage systems, whereas opportunities are expanded electrification in transportation, smart cities growth, and commercial infrastructure demand for minimal maintenance, space-efficient power distribution schemes.
Busbar is an electrical junction that collects electric current from the incoming feeders and distributes it to the outgoing feeders. It comprises a circuit breaker that trips off in the event of a fault and disconnects itself from the busbar. It offers cost-efficient and fast installation services with no downtime and makes the power distribution process easier, flexible and hassle-free. Consequently, it is extensively utilized in factories, data centers, retail facilities, hospitals, laboratories, universities, metros and railways in the United States.
With the rising environmental concerns, there is an increase in the adoption of renewable energy sources for generating power in the US. On account of the growing requirements of different industries and enterprises, power consumption is increasing significantly, which, in turn, is impelling the market growth. Moreover, the growing warehouse and storage facilities in the country is resulting in the escalating demand for busbars with low power ratings. Besides this, the Government is planning to upgrade the existing transmission and distribution (T&D) infrastructure, which is expected to create a positive outlook for the market growth.
United States Busbar Market Trends:
Growing Demand for Energy-Efficient Power Distribution Systems
The movement toward energy-efficient infrastructure is strongly driving the utilisation of next-generation power distribution systems throughout the United States. Busbars, with their high electrical conductivity and low energy losses, are gaining popularity in commercial, industrial, and institutional buildings. Their capability to enable effective load distribution, lower installation complexity, and improve thermal performance makes them suitable for advanced energy management systems. With increased demand from data centers, airports, and factories, the trend is definitely shifting towards the replacement of conventional cabling systems with busbar systems. Additionally, the increasing focus on green building certifications and sustainability programs has raised the stature of busbars in energy-efficient construction procedures. Their modular design also facilitates flexible extension and optimal utilization of space, which is of paramount importance in high-density settings. As these trends take shape, the United States Busbar Market Size is likely to grow steadily, fueled by changing standards in energy efficiency and system robustness.
Increase in Smart Grid Infrastructure
The development of smart grid technology in the United States is at the forefront of changing the landscape of electricity distribution in the nation. Busbars are central to this change since they address the operational needs of smart grid systems that need strong, scalable, and low-maintenance power distribution systems. Their usage in substations, control centers, and automated switchgear systems is helping utilities optimize grid operation while minimizing downtime and energy losses. As digital technologies, smart meters, and communication networks integrate with the grid infrastructure, it is becoming smarter and more adaptive. Busbar systems complement these developments by providing uniform electrical conductivity, fault tolerance, and modular architectures that allow for quick deployment. These features are essential in addressing the increasing demands for grid sustainability and resilience. With the full force of smart grid rollout developing across the country, the need for dependable busbar installations is increasing, driving the current change in the United States Busbar Market Trends.
Greater Use in Renewable Energy Projects
The increased trend towards clean energy is leading to an increased use of busbars in renewable energy facilities around the United States. Solar photovoltaic farms, wind farms, and hybrid power systems need high current carrying busbars that can withstand high current loads without large losses. Busbars meet this need with high-capacity yet compact designs that allow smooth integration between generation and distribution systems. Their ability to withstand harsh environmental conditions and modular capacity make them ideal for outdoor and utility-scale renewable installations. As the federal and state governments keep fostering decarbonization through positive policy initiatives and investment incentives, the renewable energy industry is expanding fast. In this arena, busbar systems are more and more being acknowledged as critical infrastructure, providing operational safety, space efficiency, and long-term reliability. These trends are propelling the market share and indicating sustained growth as realized in the latest United States busbar market analysis.
Key Market Segmentation:
IMARC Group provides an analysis of the key trends in each sub-segment of the United States busbar market report, along with forecasts at the country and regional level from 2025-2033. Our report has categorized the market based on power rating, conductor, end-user and industry.
Breakup by Power Rating:
To get more information on this market, Request Sample
- High
- Medium
- Low
Breakup by Conductor:
- Copper
- Aluminium
Breakup by End User:
- Industrial
- Commercial
- Residential
- Utilities
Breakup by Industry:
- Chemicals and Petroleum
- Metals and Mining
- Manufacturing
- Others
Breakup by Region:
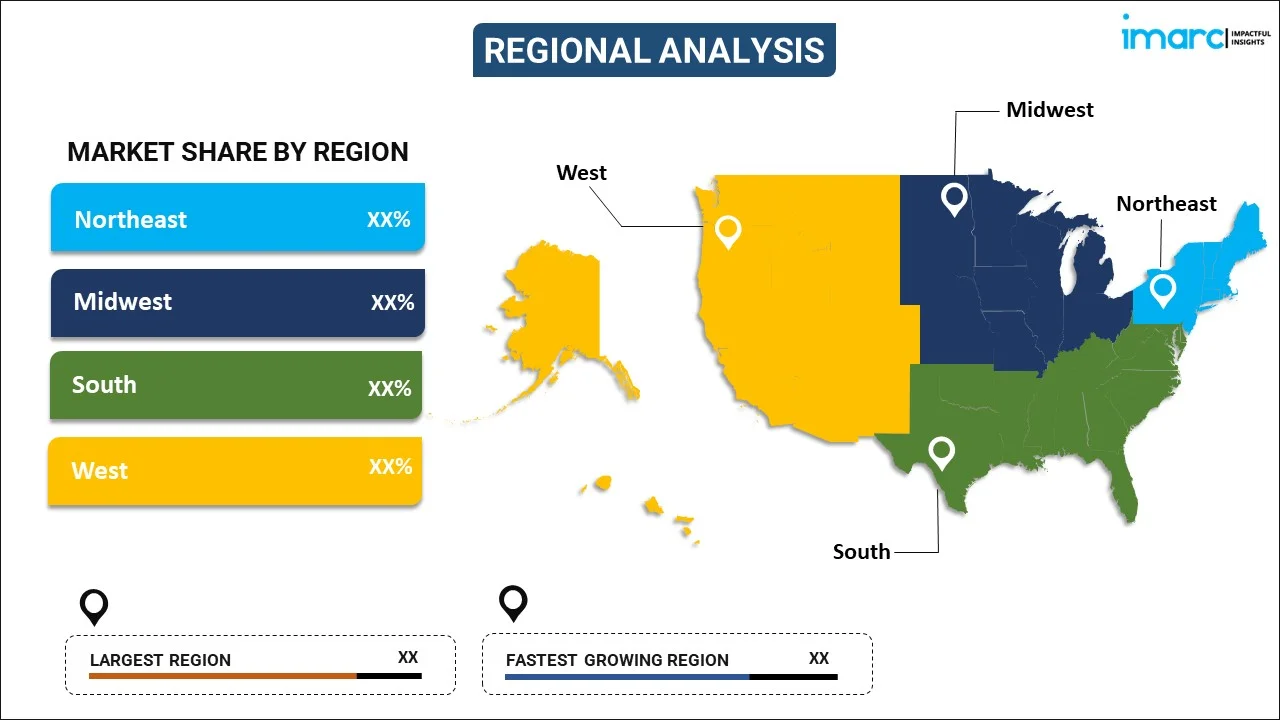
- Northeast
- Midwest
- South
- West
Competitive Landscape:
The competitive landscape of the industry has also been examined along with the profiles of the key players.
Latest News and Developments:
- In November 2024, Eaton launched xEnergy Elite low voltage motor control and power distribution center. This is a product suitable for loads up to 7,500 A and 690 VAC. Compliant with IEC standards, the device offers advanced arc-flash protection, supports IE3/IE4 motors, and provides improvement in uptime, reduction in maintenance, as well as increased personnel safety in industrial environments.
- In September 2024, Siemens released news about purchasing Trayer Engineering Corporation, a California-based weather-resistant medium voltage switchgear manufacturer. The acquisition increases Siemens' secondary power distribution capabilities for underground as well as outdoor applications and aids North American infrastructure resilience initiatives.
- In February 2024, Rogers Corporation released a new Monterrey, Mexico factory to meet expanding busbar manufacturing of advanced products. Planned for completion in late 2024, the facility will drive increasing demand in electric vehicles, renewable energy, and mass transit applications in North America through localized engineering, prototyping, and quicker supply.
Report Coverage:
| Report Features | Details |
|---|---|
| Base Year of the Analysis | 2024 |
| Historical Period | 2019-2024 |
| Forecast Period | 2025-2033 |
| Units | Million USD |
| Segment Coverage | Power Rating, Conductor, End User, Industry, Region |
| Region Covered | Northeast, Midwest, South, West |
| Customization Scope | 10% Free Customization |
| Post-Sale Analyst Support | 10-12 Weeks |
| Delivery Format | PDF and Excel through Email (We can also provide the editable version of the report in PPT/Word format on special request) |
Key Questions Answered in This Report
The busbar market in the United States was valued at USD 4,315.9 Million in 2024.
The United States busbar market is projected to exhibit a (CAGR) of 5.9% during 2025-2033, reaching a value of USD 7,420.8 Million by 2033.
United States busbar market is fueled by expanding demand for effective power distribution, smart grid infrastructure investments, rapid industrialization, and increasing renewable energy project development. There is also a demand for space-saving, low-maintenance, and energy-efficient systems fueling growth in commercial, industrial, and utility-scale applications.
Need more help?
- Speak to our experienced analysts for insights on the current market scenarios.
- Include additional segments and countries to customize the report as per your requirement.
- Gain an unparalleled competitive advantage in your domain by understanding how to utilize the report and positively impacting your operations and revenue.
- For further assistance, please connect with our analysts.
 Request Customization
 Speak to an Analyst
 Request Brochure
 Inquire Before Buying
Benefits of Customization
- Personalize this research
- Triangulate with your data
- Get data as per your format and definition
- Gain a deeper dive into a specific application, geography, customer, or competitor
- Any level of personalization
Get in Touch With Us
UNITED STATES
Phone: +1-201-971-6302
INDIA
Phone: +91-120-433-0800
UNITED KINGDOM
Phone: +44-753-714-6104
Email: sales@imarcgroup.com
Client Testimonials


.webp)


