United States Aluminium Cans Market Report by Application (Beverages, Food, and Others), and Region 2025-2033
United States Aluminium Cans Market Overview:
The United States aluminium cans market size reached 155.8 Billion Units in 2024. Looking forward, IMARC Group expects the market to reach 209.7 Billion Units by 2033, exhibiting a growth rate (CAGR) of 3.40% during 2025-2033. The market is fueled by increasing demand for eco-friendly packaging, expansion in functional drinks, and technological improvements in manufacturing. Rising consumer demand for recyclable material and adoption of circular economy practices further helps promote market growth. Though issues linger in supply chain and recycling facilities, favorable regulation and innovation help keep opportunities driving. These dynamics present a hopeful path for packaging development, which supplements the increased United States aluminium cans market share.
|
Report Attribute
|
Key Statistics
|
|---|---|
|
Base Year
|
2024
|
|
Forecast Years
|
2025-2033
|
|
Historical Years
|
2019-2024
|
| Market Size in 2024 | 155.8 Billion Units |
| Market Forecast in 2033 | 209.7 Billion Units |
| Market Growth Rate (2025-2033) | 3.40% |
United States Aluminium Cans Market Insights:
- Major Market Drivers: Growing consumer demand for recyclable and sustainable packaging, combined with growing demand from the beverage industry, is motivating the United States Aluminium Cans Market. Policies favoring circular economy initiatives also fuel the use of aluminium cans across a wide range of product lines.
- Key Market Trends: The market is seeing increasing adoption of lightweight aluminum cans and BPA-free cans. Custom shapes, resealable lids, and advanced digital printing are boosting brand differentiation. These trends allude to changing consumer behavior and environmental concerns, reshaping packaging strategies for a number of industries.
- Competitive Landscape: The industry consists of a blend of experienced players and new entrants intent on technological advancement and greener solutions. The intensity of competition is determined by spending on automation, capacity growth, and product innovation in order to address the growing demand for aluminum cans in America.
- Challenges and Opportunities: Although supply chain limitations and fluctuations in the price of aluminum present risks, opportunities exist through increased recycling capabilities and local can-sheet production. With a focus on sustainability, combined with increased functional beverage and water packaging, long-term market growth opportunities exist.
Aluminium cans are containers used to store and preserve the quality and flavor of the contents. These cans are non-toxic in nature and provide unparalleled safety and require less care for handling and distribution. They provide ease of printing and can be molded in any shape and size. Aluminium cans are lightweight, strong, affordable, easy to handle and provide resistance against air, light, and moisture. As a result, they are extensively used for extending the shelf-life of products like soft drinks, oil, chemicals, perfumes, pharmaceuticals, and cosmetics.
The United States aluminium cans market is primarily driven by the increasing demand for the packaging of processed and ready-to-eat food products, aerated drinks, fruit juices and energy drinks. These cans have also gained immense popularity due to the unprecedented demand for environment-friendly containers highly influenced by their recyclability quotient. Besides this, with the growing environmental concerns, consumers are becoming more conscious about limiting the usage of plastic packaging. Furthermore, the increasing consumption of energy and sports drinks, in confluence with the growing efforts by manufacturers to finance advertising campaigns for these drinks, is increasing the sales of aluminium cans across the country.
United States Aluminium Cans Market Trends:
Sustainable Packaging Adoption
Consumers in the United States are intensely prioritizing sustainable and recyclable packaging, making aluminum cans a preferred choice across beverage categories. This aligns with rising environmental awareness and regulatory efforts to reduce plastic waste. The lightweight and infinitely recyclable nature of aluminum supports circular economy goals, encouraging beverage producers to shift from plastic bottles to cans. As per the sources, in April 2025, Ball Corporation and Beiersdorf received the CanTech Grand Tour Award for their introduction of a 100% recycled aluminum aerosol can, which demonstrated sustainability leadership and innovation in aluminium packaging solutions. Furthermore, this is one of the most important United States aluminium cans market trends influencing manufacturing and consumption patterns. Government recycling promotions and zero-waste initiatives are also driving this trend. With sustainability emerging as a critical influence on buying decisions, demand for aluminium packaging will further accelerate in the future. These aspects are largely attributing to the United States aluminium cans market size, making the format an environmental as well as commercial benefit in packaging techniques. The market is continually advancing with developments in design, printability, and resealability for the purpose of optimizing product differentiation and consumer experience.
Increased Consumption of Functional and Flavored Drinks
The increase in demand for ready-to-drink drinks—like energy drinks, seltzer water, and flavored teas—is driving aluminum can use in the United States. These types of drinks usually need packaging that provides product protection, mobility, and appearance, which aluminum cans all deliver. Younger generations, including millennials and Gen Z, are driving this change because they prefer easy, convenient, and on-the-go products. The growing penetration of healthier drink options also supports this packaging option. Consequently, United States Aluminium cans market growth is being supported by technology advancements in beverage formulation and distribution. Furthermore, retailers prefer shelf-stable canned items to limit cold storage expenses. This changing beverage landscape also influences customization in can sizes, such as slim and sleek ones. The transition towards specialized drink segments reflects how changing consumer behavior is impacting packaging forms and fueling the overall United States aluminium cans market outlook.
Technological Developments in Can Production
Technological developments in the production of aluminum cans are exerting a revolutionary impact in the United States. Increased speed of production lines, lighter material consumption, and improved coating methods are allowing manufacturers to attain improved product integrity and aesthetic appeal at lesser costs. These advances enable more output without sacrificing recyclability or safety. Improved digital printing enables crisper branding and quicker marketing cycles, which is attractive to both small and large beverage manufacturers. Advances in technology are also enabling more versatile production lines, which have space for different can shapes and sizes. These accommodate premiumization and product diversification tendencies. These continued advancements are shaping the United States aluminium cans market outlook, which implies ongoing optimization and increasing usage across industries. In this dynamic setting, technological progression is increasingly becoming a driver of both market differentiation and scalability of production, rendering the aluminum can a flexible and future-proof packaging option in the consumer goods chain.
Key Market Segmentation:
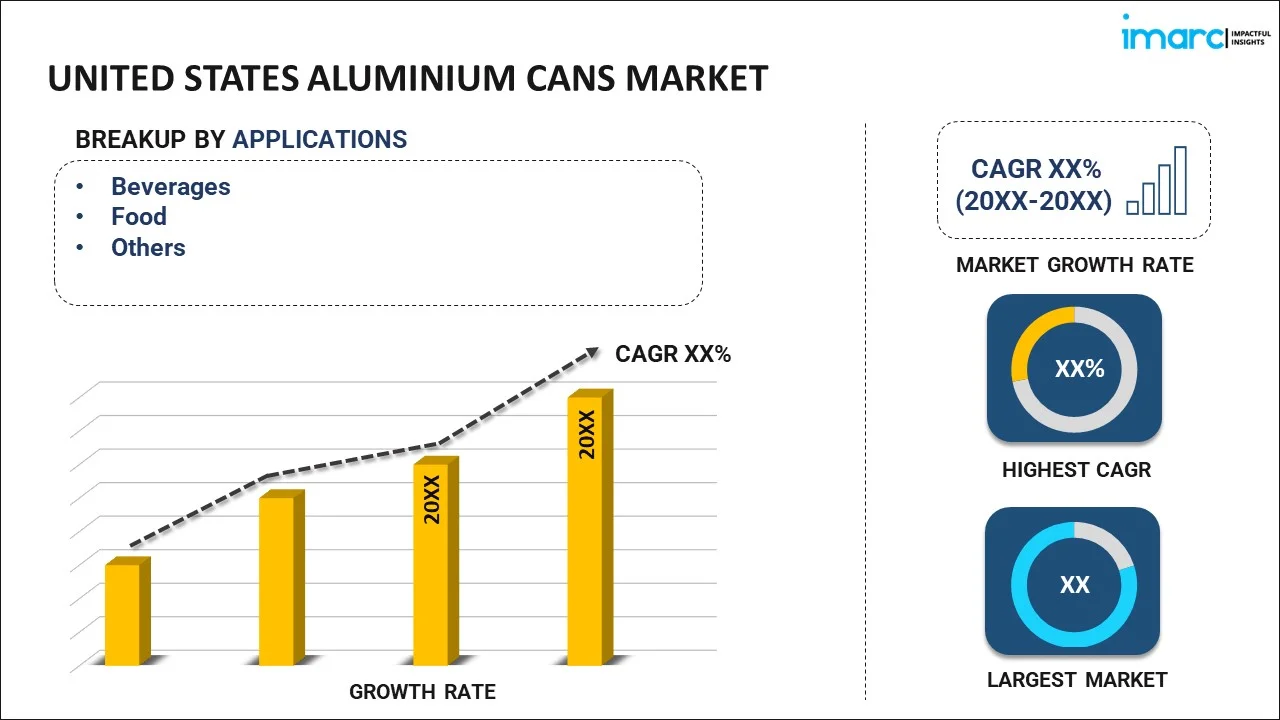
IMARC Group provides an analysis of the key trends in each sub-segment of the United States aluminium cans market report, along with forecasts at the country and regional level from 2025-2033. Our report has categorized the market based on application.
Breakup by Application:

To get more information on this market, Request Sample
- Beverages
- Food
- Others
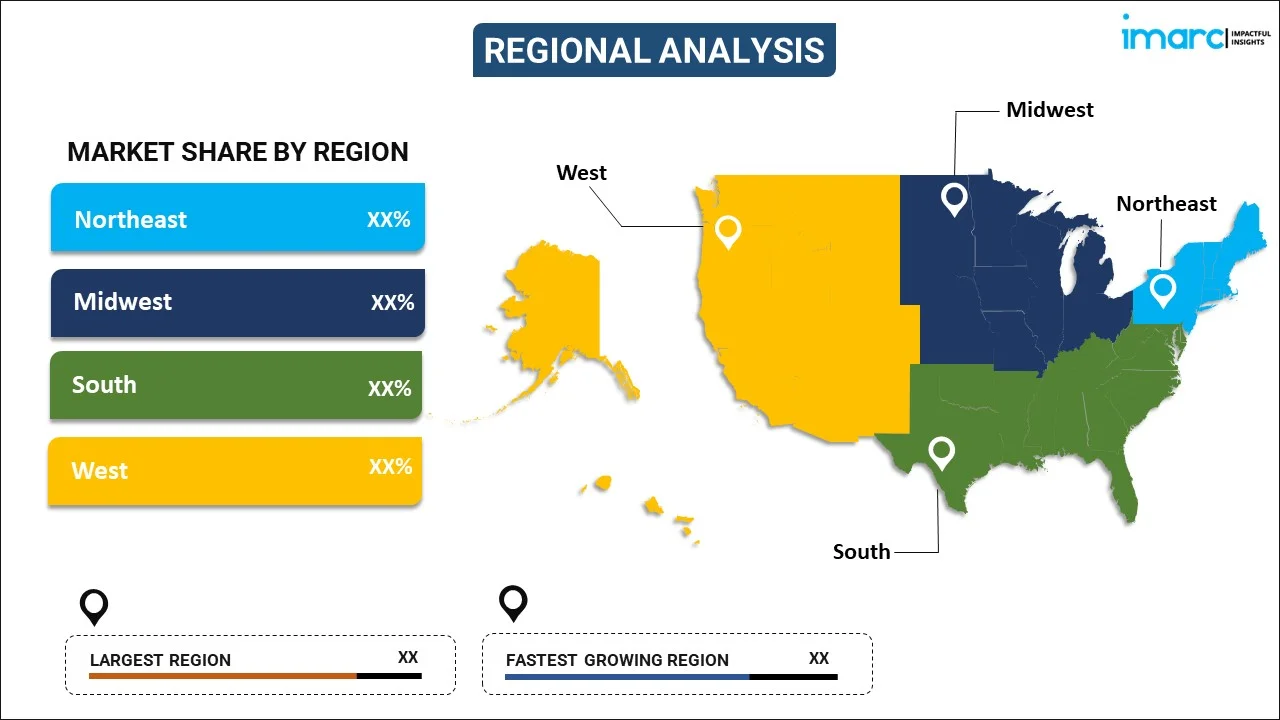
Breakup by Region:

- Northeast
- Midwest
- South
- West
Competitive Landscape:
The competitive landscape of the industry has also been examined along with the profiles of the key players.
Latest News and Developments:
- In May 2025, VulCan Packaging began the first North American manufacturing line of aTULC™ aluminum cans in Austin, Texas. This new technology removes bisphenol-based coatings and water from the form process, bringing a cleaner, more sustainable option to aluminum can manufacturing in the United States beverage packaging market.
- In April 2024, smartwater rolled out its first-ever 12-oz aluminum cans nationwide, debuting a new design for its original and alkaline with antioxidants lines. The recyclable packaging delivers high-end, vapor-distilled hydration with a touch of style, reflecting shifting consumer trends and sustainability initiatives in the U.S. aluminum cans market.
Report Coverage:
| Report Features | Details |
|---|---|
| Base Year of the Analysis | 2024 |
| Historical Period | 2019-2024 |
| Forecast Period | 2025-2033 |
| Units | Billion Units |
| Segment Coverage | Application, Region |
| Region Covered | Northeast, Midwest, South, West |
| Customization Scope | 10% Free Customization |
| Post-Sale Analyst Support | 10-12 Weeks |
| Delivery Format | PDF and Excel through Email (We can also provide the editable version of the report in PPT/Word format on special request) |
Key Questions Answered in This Report
The aluminium cans market in the United States reached at 155.8 Billion Units in 2024.
The United States aluminium cans market is projected to exhibit a CAGR of 3.40% during 2025-2033, reaching a volume of 209.7 Billion Units by 2033.
Key drivers for the United States aluminium cans market are rising demand for sustainable and recyclable packaging, a rise in consumption of ready-to-drink beverages, and regulatory encouragement of circular economy practices. Moreover, technological enhancements in lightweight can construction and sustainable manufacturing processes are propelling market growth in the beverage and non-beverage segments.
Need more help?
- Speak to our experienced analysts for insights on the current market scenarios.
- Include additional segments and countries to customize the report as per your requirement.
- Gain an unparalleled competitive advantage in your domain by understanding how to utilize the report and positively impacting your operations and revenue.
- For further assistance, please connect with our analysts.
 Request Customization
 Speak to an Analyst
 Request Brochure
 Inquire Before Buying


.webp)


.webp)


