
United States 3D Mapping and Modeling Market Report by Component (3D Mapping, 3D Modeling), Application (Projection Mapping, Texture Mapping, Maps and Navigation, and Others), End Use Industry (Construction Industry, Transportation Industry, Automobile Industry, Entertainment Industry, Healthcare Industry, and Others), and Region 2025-2033
Market Overview:
The United States 3D mapping and modeling market size reached USD 3.0 Billion in 2024. Looking forward, IMARC Group expects the market to reach USD 9.5 Billion by 2033, exhibiting a growth rate (CAGR) of 13.19% during 2025-2033. The market is primarily driven by rapid urbanization, growing smart city initiatives, and increasing infrastructure development, which demand accurate spatial data and advanced visualization. Adoption of autonomous vehicles, drones, and LiDAR technology fuels precision mapping needs. Integration with artificial intelligence (AI), GIS, and cloud platforms enhances efficiency and analytics. Additionally, government investments in geospatial intelligence, disaster management, and environmental monitoring, along with rising interest from construction, real estate, and defense sectors, further boosting the United States 3D mapping and modeling market share.
|
Report Attribute
|
Key Statistics
|
|---|---|
|
Base Year
|
2024
|
|
Forecast Years
|
2025-2033
|
|
Historical Years
|
2019-2024
|
| Market Size in 2024 | USD 3.0 Billion |
| Market Forecast in 2033 | USD 9.5 Billion |
| Market Growth Rate (2025-2033) | 13.19% |
United States 3D Mapping and Modeling Market Analysis:
- Key Market Trends: There are a few of the United States 3D mapping and modeling market trends, namely the fast acceptance of LiDAR, UAVs, and photogrammetry technologies. GIS, AI, and AR/VR integration increases real-time visualization and analysis. Demand is increasing in urban planning, self-driving cars, construction, and defense, which increases precision and efficiency in mapping and modeling processes.
- Key Drivers: Growing infrastructure construction, smart city initiatives, and autonomous vehicle (AVs) deployment are key drivers for United States 3D mapping and modeling market growth. Advances in 3D scanning technology, cloud technology, and AI-driven analytics drive adoption. Government programs enhancing geospatial intelligence, environmental management, and disaster management further spur investments, sustaining a healthy ecosystem for 3D mapping and modeling solutions.
- Market Opportunities: New uses of AR/VR, digital twins, and city planning present large opportunities in the United States 3D mapping and modeling market study. Integration with Artificial Intelligence (AI) and Internet of Things (IoT) supports predictive modeling and real-time simulation. Increased interest of construction, energy, and defense industries, as well as federal and state grants for smart infrastructure initiatives, can increase market penetration and establish niche high-value segments.
- Market Challenges: Three-dimensional (3D) mapping devices and software are expensive, keeping small and medium-sized businesses away based on the United States 3D mapping and modeling market analysis. Data storage, privacy, and legal compliances are challenges. Data processing complexity and platform interoperability are technical challenges, as is the shortage of human capital in geospatial analytics, hampering growth in the United States market despite increased demand.
3D mapping is the three-dimensional, realistic virtual representation of an area or object that is mathematically defined and generated by the computer. The most frequently used 3D mapping technique includes photogrammetry that offers greater efficiency in the horizontal direction and laser scanning, which provides precision in the vertical direction. They reduce inconsistencies while improving the accuracy of mapping products. On the other hand, 3D modeling refers to the process of using software to create a mathematical representation of 3D objects. They are used in various industries and help in simulating, visualizing and rendering graphic designs.
The United States 3D mapping and modeling market is primarily driven by the rising demand for these solutions in the defense, military, and aerospace industries. Besides this, rapid technological innovations in the construction industry have also escalated the demand for 3D mapping and modeling to help to analyze ventilation, visibility and sunlight distribution in buildings. They also provide the shapes and dimensions of landscape features and architecture of an area while allowing easy handling of massive data. Moreover, increasing product innovations have provided high-value data modeling and 3D visualization services for utility companies in the region. The market is further propelled by the use of these technologies for improving geospatial intelligence and enhancing situational awareness across different domains.
Key Market Segmentation:
IMARC Group provides an analysis of the key trends in each sub-segment of the United States 3D mapping and modeling market report, along with forecasts at the country and regional level from 2025-2033. Our report has categorized the market based on component, application and end use industry.
Breakup by Component:
To get more information on this market, Request Sample
- 3D Mapping
- 3D Modeling
Breakup by Application:
- Projection Mapping
- Texture Mapping
- Maps and Navigation
- Others
Breakup by End Use Industry:
- Construction Industry
- Transportation Industry
- Automobile Industry
- Entertainment Industry
- Healthcare Industry
- Others
Breakup by Region:
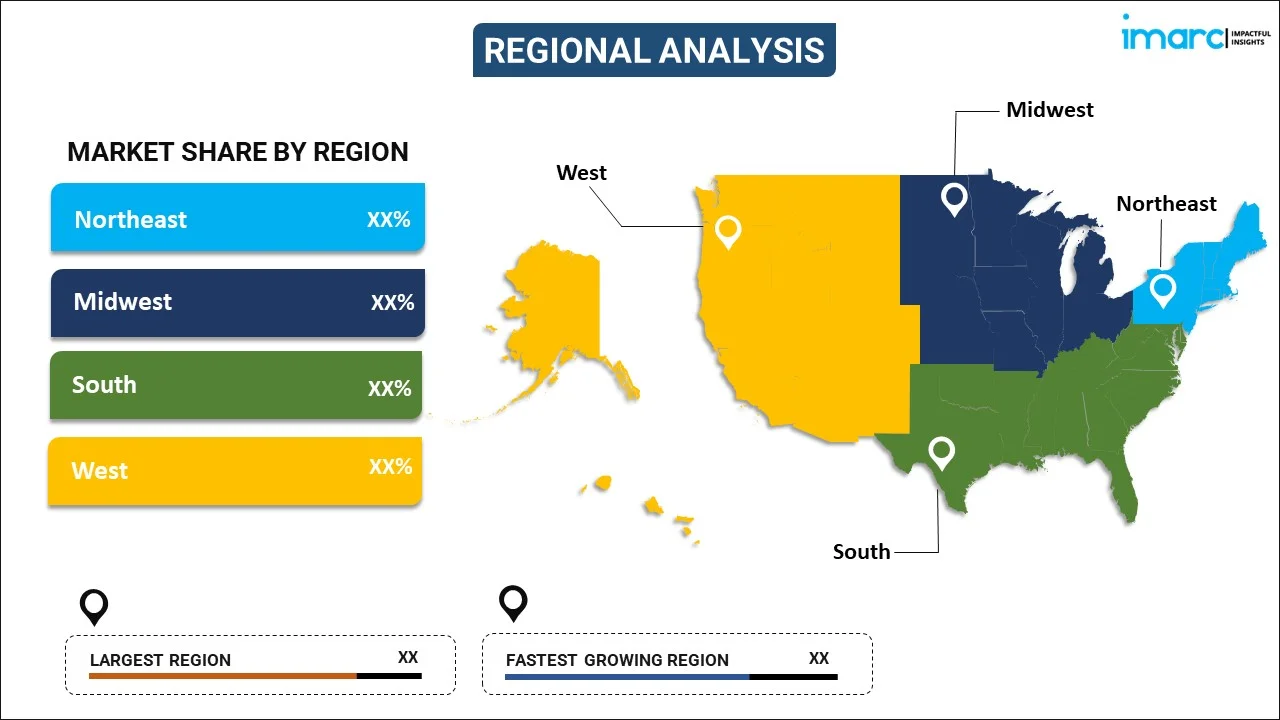
- Northeast
- Midwest
- South
- West
Competitive Landscape:
The competitive landscape of the industry has also been examined along with the profiles of the key players.
Latest News and Developments:
- In January 2025, Simplex 3D and First American launched a cutting-edge 3D platform for real estate professionals in the Greater New York Metro area. Combining Simplex 3D’s high-resolution urban modeling with First American’s extensive property and financial data, the platform enables developers, architects, and planners to visualize, analyze, and collaborate in a fully interactive 3D environment. Features include shadow analysis, architectural model imports, and detailed 360° property assessments, enhancing informed decision-making and forecasting.
- In January 2024, DJI launched DJI Modify, its first intelligent 3D model editing software, complementing DJI Terra for a complete aerial surveying and modeling solution. The software simplifies repairing common 3D model defects, enabling efficient workflows for surveyors, transportation operators, and emergency responders. Seamlessly integrated with DJI Terra, DJI Modify automatically generates editable files, pre-identifies objects, and streamlines model processing, enhancing precision and efficiency in 3D mapping and editing projects.
Report Coverage:
| Report Features | Details |
|---|---|
| Base Year of the Analysis | 2024 |
| Historical Period | 2019-2024 |
| Forecast Period | 2025-2033 |
| Units | Billion USD |
|
Scope of the Report
|
Exploration of Historical and Forecast Trends, Industry Catalysts and Challenges, Segment-Wise Historical and Predictive Market Assessment:
|
| Components Covered | 3D Mapping, 3D Modeling |
| Applications Covered | Projection Mapping, Texture Mapping, Maps and Navigation, Others |
| End Use Industries Covered | Construction Industry, Transportation Industry, Automobile Industry, Entertainment Industry, Healthcare Industry, Others |
| Regions Covered | Northeast, Midwest, South, West |
| Customization Scope | 10% Free Customization |
| Post-Sale Analyst Support | 10-12 Weeks |
| Delivery Format | PDF and Excel through Email (We can also provide the editable version of the report in PPT/Word format on special request) |
Key Questions Answered in This Report
The 3D mapping and modeling market in the United States was valued at USD 3.0 Billion in 2024.
The United States 3D mapping and modeling market is projected to exhibit a CAGR of 13.19% during 2025-2033, reaching a value of USD 9.5 Billion by 2033.
The U.S. 3D mapping and modeling market is driven by rising demand in autonomous vehicles, urban planning, and construction, coupled with technological advancements in LiDAR, drones, and AI-based imaging. Government initiatives, defense applications, and increased investment in geospatial analytics further accelerate adoption and market growth.
Need more help?
- Speak to our experienced analysts for insights on the current market scenarios.
- Include additional segments and countries to customize the report as per your requirement.
- Gain an unparalleled competitive advantage in your domain by understanding how to utilize the report and positively impacting your operations and revenue.
- For further assistance, please connect with our analysts.
 Request Customization
 Speak to an Analyst
 Request Brochure
 Inquire Before Buying
Benefits of Customization
- Personalize this research
- Triangulate with your data
- Get data as per your format and definition
- Gain a deeper dive into a specific application, geography, customer, or competitor
- Any level of personalization
Get in Touch With Us
UNITED STATES
Phone: +1-201-971-6302
INDIA
Phone: +91-120-433-0800
UNITED KINGDOM
Phone: +44-753-714-6104
Email: sales@imarcgroup.com
Client Testimonials


.webp)


