
Toluene Prices, Trend, Chart, Demand, Market Analysis, News, Historical and Forecast Data Report 2026 Edition
Toluene Price Trend and Forecast
Track real-time and historical toluene prices across global regions. Updated monthly with market insights, drivers, and forecasts.
Toluene Prices May 2026
| Region | Price (USD/Kg) | Latest Movement |
|---|---|---|
| Northeast Asia | 1.08 | Unchanged |
| Europe | 1.04 | -1.9% ↓ Down |
| South America | 0.77 | -6.1% ↓ Down |
| Southeast Asia | 0.9 | 3.4% ↑ Up |
| North America | 0.92 | Unchanged |
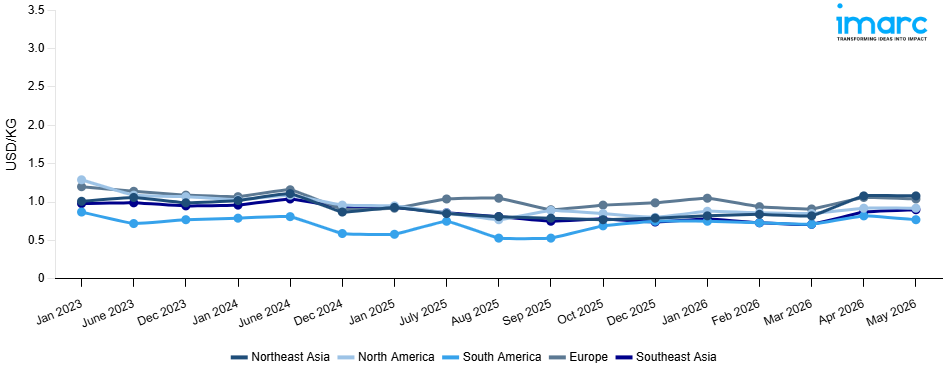
Toluene Price Index (USD/KG):
The chart below highlights monthly toluene prices across different regions.
Get Access to Monthly/Quarterly/Yearly Prices, Request Sample
Market Overview Q3 Ending September 2025
Northeast Asia: Demand from downstream sectors, particularly paints, coatings, and polyurethane intermediates, remained subdued due to slower construction activity in China and weak automotive output in South Korea. On the supply side, Chinese refiners increased operating rates following spring maintenance, contributing to inventory buildup. Export competitiveness was further challenged by unfavorable currency fluctuations against the U.S. dollar, raising landed costs for regional buyers. Despite this, the demand pull from India provided limited relief for regional suppliers.
Europe: Toluene prices faced downward pressure due to weak consumption in the coatings, adhesives, and automotive sectors. Demand-side weakness was compounded by persistent inflation across the Eurozone, which dampened industrial activity. On the supply side, abundant imports from Asia, offered at competitive prices due to currency depreciation of the yuan against the euro, further undermined domestic producers’ margins. Energy cost volatility, particularly linked to natural gas and electricity pricing, impacted refinery economics and production costs.
South America: In South America, toluene market experienced moderate stability, supported by resilient downstream demand from Brazil’s automotive and adhesives industries. Domestic consumption was steady, while regional refiners maintained balanced production rates, preventing significant supply shocks. However, higher freight costs driven by global shipping rate increases, port congestion in Brazil, and customs delays in Argentina created cost pressures on importers. Currency volatility, particularly the depreciation of the Argentine peso, also inflated landed costs for buyers relying on imports.
Southeast Asia: Downstream consumption in Indonesia, Malaysia, and Thailand was sluggish due to subdued performance in the construction and furniture industries, which reduced demand for toluene-based coatings and solvents. On the supply side, higher refinery operating rates in Singapore and Malaysia, coupled with increased Chinese exports into the region, created competitive pricing pressure. Additionally, seasonal monsoon disruptions in parts of the region caused delays in logistics, raising domestic handling and warehousing costs. Importers also faced higher compliance costs for documentation and customs procedures, particularly for shipments routed through Singapore.
North America: The pricing surge was primarily attributed to rising demand from downstream sectors, particularly in the production of toluene diisocyanate (TDI), benzene, and solvents for paints and coatings. Seasonal activity in the construction and automotive industries boosted solvent and chemical consumption, tightening availability. US Gulf Coast refineries constrained toluene output, while strong gasoline blending demand further reduced merchant supply available for chemical use. Feedstock dynamics also factored in: stronger crude oil and naphtha values in Q3 raised overall aromatics costs, which supported higher toluene market assessments.
Toluene Price Trend, Market Analysis, and News
IMARC's latest publication, “Toluene Prices, Trend, Chart, Demand, Market Analysis, News, Historical and Forecast Data Report 2026 Edition,” presents a detailed examination of the toluene market, providing insights into both global and regional trends that are shaping prices. This report delves into the spot price of toluene at major ports and analyzes the composition of prices, including FOB and CIF terms. It also presents detailed toluene prices trend analysis by region, covering North America, Europe, Asia Pacific, Latin America, and Middle East and Africa. The factors affecting toluene pricing, such as the dynamics of supply and demand, geopolitical influences, and sector-specific developments, are thoroughly explored. This comprehensive report helps stakeholders stay informed with the latest market news, regulatory updates, and technological progress, facilitating informed strategic decision-making and forecasting.
.webp)
Toluene Industry Analysis
The global toluene industry size reached USD 30.23 Billion in 2025. By 2034, IMARC Group expects the market to reach USD 45.31 Billion, at a projected CAGR of 4.37% during 2026-2034. The market is driven by the rising demand for toluene-derived chemicals such as benzene, xylene, and toluene diisocyanate, alongside increasing applications in paints, coatings, adhesives, and the expanding petrochemical sector.
Latest developments in the Toluene Industry:
- January 2025: The Union Minister of Petroleum of India launched the toluene product at Mangalore Refinery and Petrochemicals Ltd (MRPL). With an annual production capacity of 40,000 tons, this new facility will help reduce India's reliance on imports and save around $3 million annually in foreign exchange. Toluene is vital for industries such as pharmaceuticals, chemicals, and paints.
- June 2024: The Chairman and Managing Director of Epigral announced the company's plans to commission India’s first Chlorotoluene and its value chain plant with a capacity of 15,000 TPA. The plant is expected to cater to the agrochemical and pharmaceutical industries, with the full facility slated for completion by Q2 FY25.
- March 2024: SABIC and Fujian Energy and Petrochemical Group (FEPG) awarded contracts for a new olefins and derivatives complex in Zhangzhou, China. Lummus Technology will provide licensing and design for the mixed-feed steam cracker, producing 1.8 million tpy of ethylene and also supporting the production of toluene along with other products. The $6.4 billion project is expected to be completed by 2026.
- March 2024: Cepsa launched its Digitalization Plan at the San Roque Energy Park, investing €13 million to implement 5G, IIoT, and AI for efficiency and safety. This initiative positions Cepsa as a highly digitalized and interconnected leader in the energy sector, optimizing operations and enhancing user experience.
- October 2023: Versalis, Eni’s chemical company, collaborates with S.R.S. to build a demo plant in Mantua for Hoop, a chemical recycling technology for mixed plastic waste. Partnering with Corepla, the project aims to enhance post-consumer plastic value, integrating with Technip Energies' pyrolysis product purification technologies. The Hoop demo plant, scheduled to operate by 2024-end, will handle 6,000 tons of secondary raw material.
- September 2023: British Petroleum secured its third long-term LNG offtake contract from Woodfibre's British Columbia LNG facility, committing all output for sale. This expands BP's LNG portfolio and supports energy transition and security amidst the growing importance of LNG.
Product Description
Toluene (C₆H₅CH₃) is an aromatic hydrocarbon, a clear, colorless liquid with a distinctive sweet odor, derived mainly from petroleum and coal tar sources. It holds a significant role in the global petrochemical chain as both a solvent and a chemical intermediate. Its high solvency power makes it integral to paints, coatings, adhesives, and inks, while its role as a feedstock supports production of benzene, xylene, and toluene diisocyanate (TDI) for polyurethanes. Additionally, toluene is used in the formulation of octane boosters for gasoline blending, enhancing fuel efficiency. Its chemical versatility, solvent properties, and role in downstream derivatives make it indispensable across automotive, construction, and consumer goods industries.
Report Coverage
| Key Attributes | Details |
|---|---|
| Product Name | Toluene |
| Report Features | Exploration of Historical Trends and Market Outlook, Industry Demand, Industry Supply, Gap Analysis, Challenges, Toluene Price Analysis, and Segment-Wise Assessment. |
| Currency/Units | US$ (Data can also be provided in local currency) or Metric Tons |
| Region/Countries Covered | The current coverage includes analysis at the global and regional levels only. Based on your requirements, we can also customize the report and provide specific information for the following countries: Asia Pacific: China, India, Indonesia, Pakistan, Bangladesh, Japan, Philippines, Vietnam, Thailand, South Korea, Malaysia, Nepal, Taiwan, Sri Lanka, Hongkong, Singapore, Australia, and New Zealand* Europe: Germany, France, United Kingdom, Italy, Spain, Russia, Turkey, Netherlands, Poland, Sweden, Belgium, Austria, Ireland, Switzerland, Norway, Denmark, Romania, Finland, Czech Republic, Portugal and Greece* North America: United States and Canada Latin America: Brazil, Mexico, Argentina, Columbia, Chile, Ecuador, and Peru* Middle East & Africa: Saudi Arabia, UAE, Israel, Iran, South Africa, Nigeria, Oman, Kuwait, Qatar, Iraq, Egypt, Algeria, and Morocco* *The list of countries presented is not exhaustive. Information on additional countries can be provided if required by the client. |
| Information Covered for Key Suppliers |
|
| Customization Scope | The report can be customized as per the requirements of the customer |
| Report Price and Purchase Option |
Plan A: Monthly Updates - Annual Subscription
Plan B: Quarterly Updates - Annual Subscription
Plan C: Biannually Updates - Annual Subscription
|
| Post-Sale Analyst Support | 360-degree analyst support after report delivery |
| Delivery Format | PDF and Excel through email (We can also provide the editable version of the report in PPT/Word format on special request) |
Key Benefits for Stakeholders:
- IMARC’s report presents a detailed analysis of toluene pricing, covering global and regional trends, spot prices at key ports, and a breakdown of Ex Works, FOB, and CIF prices.
- The study examines factors affecting toluene price trend, including raw material costs, supply-demand shifts, geopolitical impacts, and industry developments, offering insights for informed decision-making.
- The competitive landscape review equips stakeholders with crucial insights into the latest market news, regulatory changes, and technological advancements, ensuring a well-rounded, strategic overview for forecasting and planning.
- IMARC offers various subscription options, including monthly, quarterly, and biannual updates, allowing clients to stay informed with the latest market trends, ongoing developments, and comprehensive market insights. The toluene price charts ensure our clients remain at the forefront of the industry.
Frequently Asked Questions About the Toluene Price Trend Report
The toluene prices in May 2026 were 1.08 USD/Kg in Northeast Asia, 1.04 USD/Kg in Europe, 0.77 USD/Kg in South America, 0.9 USD/Kg in Southeast Asia, and 0.92 USD/Kg in North America.
The toluene pricing data is updated on a monthly basis.
We provide the pricing data primarily in the form of an Excel sheet and a PDF.
Yes, our report includes a forecast for toluene prices.
The regions covered include North America, Europe, Asia Pacific, Middle East, and Latin America. Countries can be customized based on the request (additional charges may be applicable).
Yes, we provide both FOB and CIF prices in our report.
Need more help?
- Speak to our experienced analysts for insights on the current market scenarios.
- Include additional segments and countries to customize the report as per your requirement.
- Gain an unparalleled competitive advantage in your domain by understanding how to utilize the report and positively impacting your operations and revenue.
- For further assistance, please connect with our analysts.
 Request Customization
 Inquire Before Buying
 Speak to an Analyst
 Request Brochure
Benefits of Customization
- Personalize this research
- Triangulate with your data
- Get data as per your format and definition
- Gain a deeper dive into a specific application, geography, customer, or competitor
- Any level of personalization
Get in Touch With Us
UNITED STATES
Phone: +1-201-971-6302
INDIA
Phone: +91-120-433-0800
UNITED KINGDOM
Phone: +44-753-714-6104
Email: [email protected]
Client Testimonials


.webp)


Why Choose Us
IMARC offers trustworthy, data-centric insights into commodity pricing and evolving market trends, enabling businesses to make well-informed decisions in areas such as procurement, strategic planning, and investments. With in-depth knowledge spanning more than 1000 commodities and a vast global presence in over 150 countries, we provide tailored, actionable intelligence designed to meet the specific needs of diverse industries and markets.
1000
+Commodities
150
+Countries Covered
3000
+Clients
20
+Industry
Robust Methodologies & Extensive Resources
IMARC delivers precise commodity pricing insights using proven methodologies and a wealth of data to support strategic decision-making.
Subscription-Based Databases
Our extensive databases provide detailed commodity pricing, import-export trade statistics, and shipment-level tracking for comprehensive market analysis.
Primary Research-Driven Insights
Through direct supplier surveys and expert interviews, we gather real-time market data to enhance pricing accuracy and trend forecasting.
Extensive Secondary Research
We analyze industry reports, trade publications, and market studies to offer tailored intelligence and actionable commodity market insights.
Trusted by 3000+ industry leaders worldwide to drive data-backed decisions. From global manufacturers to government agencies, our clients rely on us for accurate pricing, deep market intelligence, and forward-looking insights.