
Singapore Level Sensors Market Size, Share, Trends and Forecast by Technology, Monitoring Type, End Use Industry, and Region, 2026-2034
Singapore Level Sensors Market Overview:
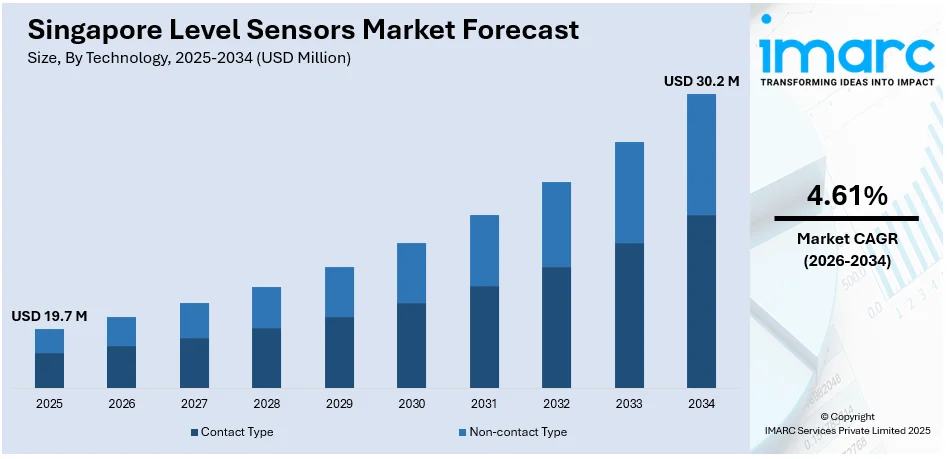
The Singapore level sensors market size reached USD 19.7 Million in 2025. Looking forward, IMARC Group expects the market to reach USD 30.2 Million by 2034, exhibiting a growth rate (CAGR) of 4.61% during 2026-2034. The market is driven by advancements in IoT integration, wireless and smart sensor technologies, and accelerated miniaturization devices and inclusion of eco-friendly materials. Key sectors including manufacturing, water management, and aviation, focusing on efficiency, sustainability, and safety, is contributing to the market growth significantly.
|
Report Attribute
|
Key Statistics
|
|---|---|
|
Base Year
|
2025
|
|
Forecast Years
|
2026-2034
|
|
Historical Years
|
2020-2025
|
|
Market Size in 2025
|
USD 19.7 Million |
|
Market Forecast in 2034
|
USD 30.2 Million |
| Market Growth Rate 2026-2034 | 4.61% |
Singapore Level Sensors Market Trends:
The integration of Internet of Things technology with level sensors is revolutionizing industrial operations by enabling remote monitoring and data collection. This trend allows industries such as manufacturing, chemical processing and water management to continuously monitor liquid levels in tanks, pipes and reservoirs from remote locations. For instance, Singapore’s Public Utilities Board (PUB) has intensified their efforts to manage flood risks. PUB added 400 water level sensors, enhanced rainfall forecasting and collaborated with an automotive app to alert motorists of flood risks. The board also utilizes X-band radar technology and a “nowcast” model to forecast heavy rain accurately. The real time data generated by IoT enabled level sensors provide critical insights into resource usage which helps in optimizing operations and reduce waste. Furthermore, this connectivity facilitates predictive maintenance where potential issues like leaks or equipment malfunctions are identified and addressed before they lead to costly downtime. This proactive maintenance approach not only enhances operational efficiency but also extends the lifespan of critical infrastructure making it a key driver of industry wide improvements in reliability and sustainability.
To get more information on this market Request Sample
Rising Prevalence of Smart Sensors
Smart sensors represent a significant advancement in the field of sensor technology, featuring capabilities such as self-calibration and diagnostics. These features enable sensors to maintain accuracy over time, reduce the need for frequent manual adjustments and ensure consistent performance. For instance, in 2021, Changi Airport installed solar-power sensors in its drain network to mitigate flash floods caused by intense rainfall, climate change and rising sea levels. The sensors are equipped with radar and CCTV cameras, monitor water levels and alert maintenance teams if water level exceeds 60%. This initiative aims to enhance safety, protect the runway operations and ensure air connectivity. Self-calibration allows the sensors to adjust themselves based on environmental changes or after maintenance activities, enhancing their reliability. Diagnostic capabilities help in preemptively identifying potential issues which can prevent failures and minimize downtime in critical applications thereby improving the operational efficiency and safety across various industries.
Singapore Level Sensors Market News:
- In October 2023, Tack One, a Singapore-based global location intelligence company, launched the Tack EVO FloodFinder™, the world's first palm-sized, autonomous flood detection device. It is a solar-powered and weather-resilient solution that monitors water levels with unparalleled accuracy, powered by Infineon Technologies' sensor technology. The device aims to provide early flood warnings in flood-prone areas to mitigate the devastating impact of flooding, particularly in the Asia-Pacific region.
- In March 2023, SPTel, a joint venture company of ST Engineering and SP Group, has launched Singapore's first sensor network powered by LoRaWAN, using solar energy for their gateways. The network aims to facilitate the accessibility of IoT technologies and sensors for business applications, government projects, and Smart Nation initiatives. The LoRaWAN gateways are cost-efficient and fast to deploy, making them suitable for various applications such as asset tracking, street lighting, waste management, and more.
Singapore Level Sensors Market Segmentation:
IMARC Group provides an analysis of the key trends in each segment of the market, along with forecasts at the country level for 2026-2034. Our report has categorized the market based on technology, monitoring type, and end use industry.
Technology Insights:
- Contact Type
- Capacitive
- Conductive
- Magnetic Float
- Vibratory Probe
- Others
- Non-contact Type
- Ultrasonic
- Radar/Microwave
- Laser
- Others
The report has provided a detailed breakup and analysis of the market based on the technology. This includes contact type (capacitive, conductive, magnetic float, vibratory probe, and others) and non-contact type (ultrasonic, radar/microwave, laser, and others).
Monitoring Type Insights:
- Point Level
- Continuous Level
A detailed breakup and analysis of the market based on the monitoring type have also been provided in the report. This includes point level and continuous level.
End Use Industry Insights:
Access the comprehensive market breakdown Request Sample
- Chemicals and Petrochemicals
- Pharmaceutical
- Energy and Power
- Oil and Gas
- Waste and Wastewater Treatment
- Food and Beverages
- Others
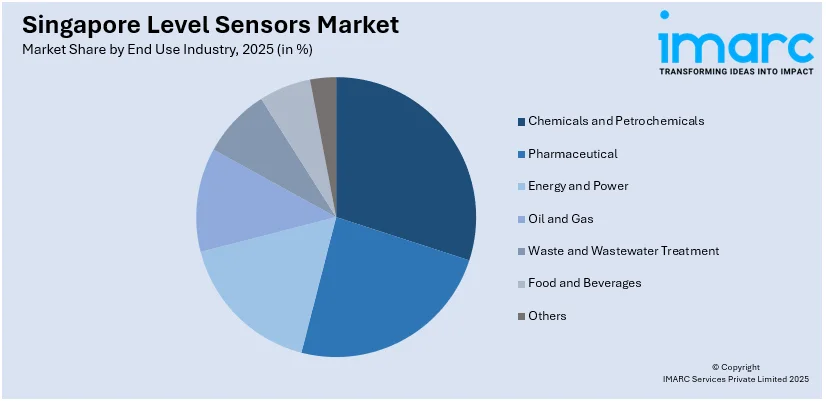
The report has provided a detailed breakup and analysis of the market based on the end use industry. This includes chemicals and petrochemicals, pharmaceutical, energy and power, oil and gas, waste and wastewater treatment, food and beverages, and others.
Regional Insights:
- North-East
- Central
- West
- East
- North
The report has also provided a comprehensive analysis of all the major regional markets, which include North-East, Central, West, East, and North.
Competitive Landscape:
The market research report has also provided a comprehensive analysis of the competitive landscape in the market. Competitive analysis such as market structure, key player positioning, top winning strategies, competitive dashboard, and company evaluation quadrant has been covered in the report. Also, detailed profiles of all major companies have been provided.
Singapore Level Sensors Market Report Coverage:
| Report Features | Details |
|---|---|
| Base Year of the Analysis | 2025 |
| Historical Period | 2020-2025 |
| Forecast Period | 2026-2034 |
| Units | Million USD |
| Scope of the Report | Exploration of Historical Trends and Market Outlook, Industry Catalysts and Challenges, Segment-Wise Historical and Future Market Assessment:
|
| Technologies Covered |
|
| Monitoring Types Covered | Point Level, Continuous Level |
| End Use Industries Covered | Chemicals and Petrochemicals, Pharmaceutical, Energy and Power, Oil and Gas, Waste and Wastewater Treatment, Food and Beverages, Others |
| Regions Covered | North-East, Central, West, East, North |
| Customization Scope | 10% Free Customization |
| Post-Sale Analyst Support | 10-12 Weeks |
| Delivery Format | PDF and Excel through Email (We can also provide the editable version of the report in PPT/Word format on special request) |
Key Questions Answered in This Report:
- How has the Singapore level sensors market performed so far and how will it perform in the coming years?
- What is the breakup of the Singapore level sensors market on the basis of technology?
- What is the breakup of the Singapore level sensors market on the basis of monitoring type?
- What is the breakup of the Singapore level sensors market on the basis of end use industry?
- What are the various stages in the value chain of the Singapore level sensors market?
- What are the key driving factors and challenges in the Singapore level sensors?
- What is the structure of the Singapore level sensors market and who are the key players?
- What is the degree of competition in the Singapore level sensors market?
Key Benefits for Stakeholders:
- IMARC’s industry report offers a comprehensive quantitative analysis of various market segments, historical and current market trends, market forecasts, and dynamics of the Singapore level sensors market from 2020-2034.
- The research report provides the latest information on the market drivers, challenges, and opportunities in the Singapore level sensors market.
- Porter's five forces analysis assist stakeholders in assessing the impact of new entrants, competitive rivalry, supplier power, buyer power, and the threat of substitution. It helps stakeholders to analyze the level of competition within the Singapore level sensors industry and its attractiveness.
- Competitive landscape allows stakeholders to understand their competitive environment and provides an insight into the current positions of key players in the market.
Need more help?
- Speak to our experienced analysts for insights on the current market scenarios.
- Include additional segments and countries to customize the report as per your requirement.
- Gain an unparalleled competitive advantage in your domain by understanding how to utilize the report and positively impacting your operations and revenue.
- For further assistance, please connect with our analysts.
 Request Customization
 Speak to an Analyst
 Request Brochure
 Inquire Before Buying
Benefits of Customization
- Personalize this research
- Triangulate with your data
- Get data as per your format and definition
- Gain a deeper dive into a specific application, geography, customer, or competitor
- Any level of personalization
Get in Touch With Us
UNITED STATES
Phone: +1-201-971-6302
INDIA
Phone: +91-120-433-0800
UNITED KINGDOM
Phone: +44-753-714-6104
Email: sales@imarcgroup.com
Client Testimonials


.webp)


