
Reverse Logistics Market Size, Share, Trends and Forecast by Return Type, Service, End User, and Region, 2026-2034
Global Reverse Logistics Market Size, Share, Trends & Forecast (2026-2034)
The global reverse logistics market size was valued at USD 711.1 Billion in 2025 and is projected to reach USD 1,076.3 Billion by 2034, growing at a CAGR of 4.70% during 2026-2034. Surging e-commerce returns, rising sustainability mandates, and rapid adoption of AI and IoT-led returns management platforms are driving the reverse logistics market growth. Commercial returns lead with 38.6% share in 2025, while E-Commerce accounts for 28.5% of global demand. Asia-Pacific dominates with 36.8% of global revenue in 2025.
Market Snapshot
|
Metric |
Value |
|
Market Size (2025) |
USD 711.1 Billion |
|
Forecast Market Size (2034) |
USD 1,076.3 Billion |
|
CAGR (2026-2034) |
4.70% |
|
Base Year |
2025 |
|
Historical Period |
2020-2025 |
|
Forecast Period |
2026-2034 |
|
Largest Region |
Asia-Pacific (36.8% share, 2025) |
|
Fastest Growing Region |
Asia-Pacific (CAGR ~5.4%) |
|
Leading Return Type |
Commercial Returns (38.6%, 2025) |
|
Leading End User |
E-Commerce (28.5%, 2025) |
The global reverse logistics market growth trajectory from 2020 through 2034 contrasts steady historical expansion against an accelerating forecast curve, powered by online returns volume, circular-economy adoption, and sustainability-led recovery models across consumer-facing industries.
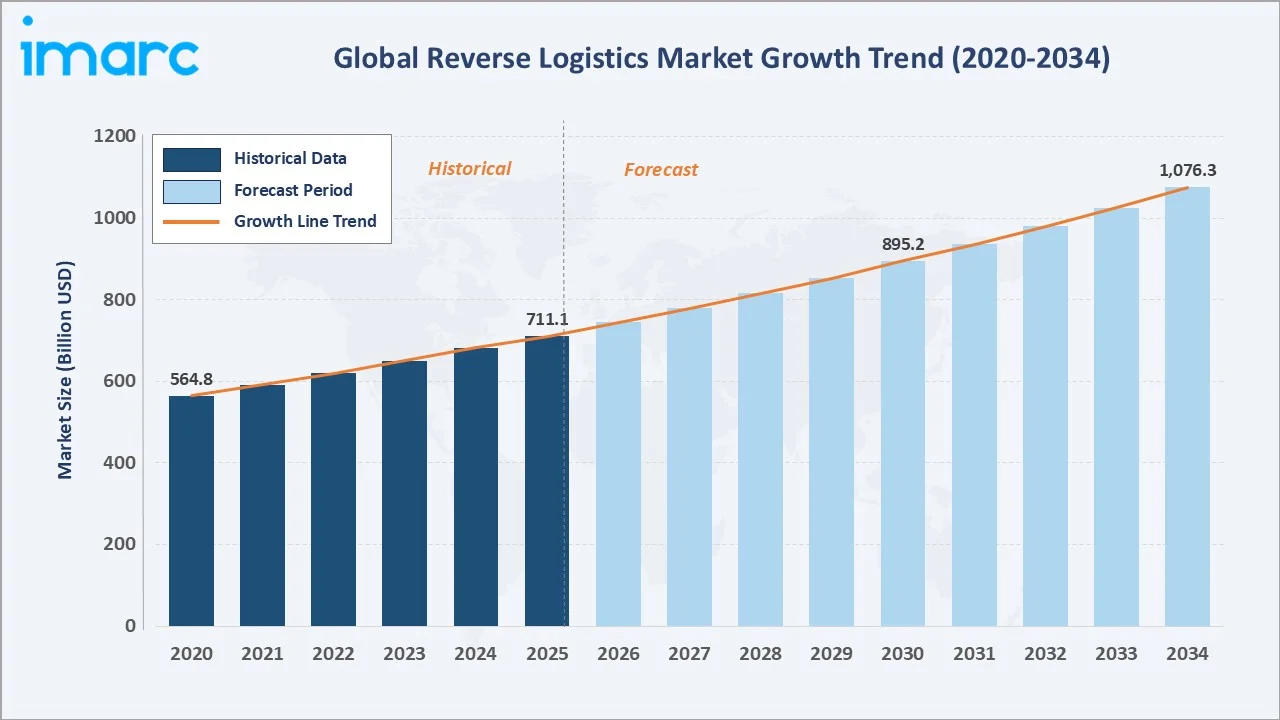
To get more information on this market, Request Sample
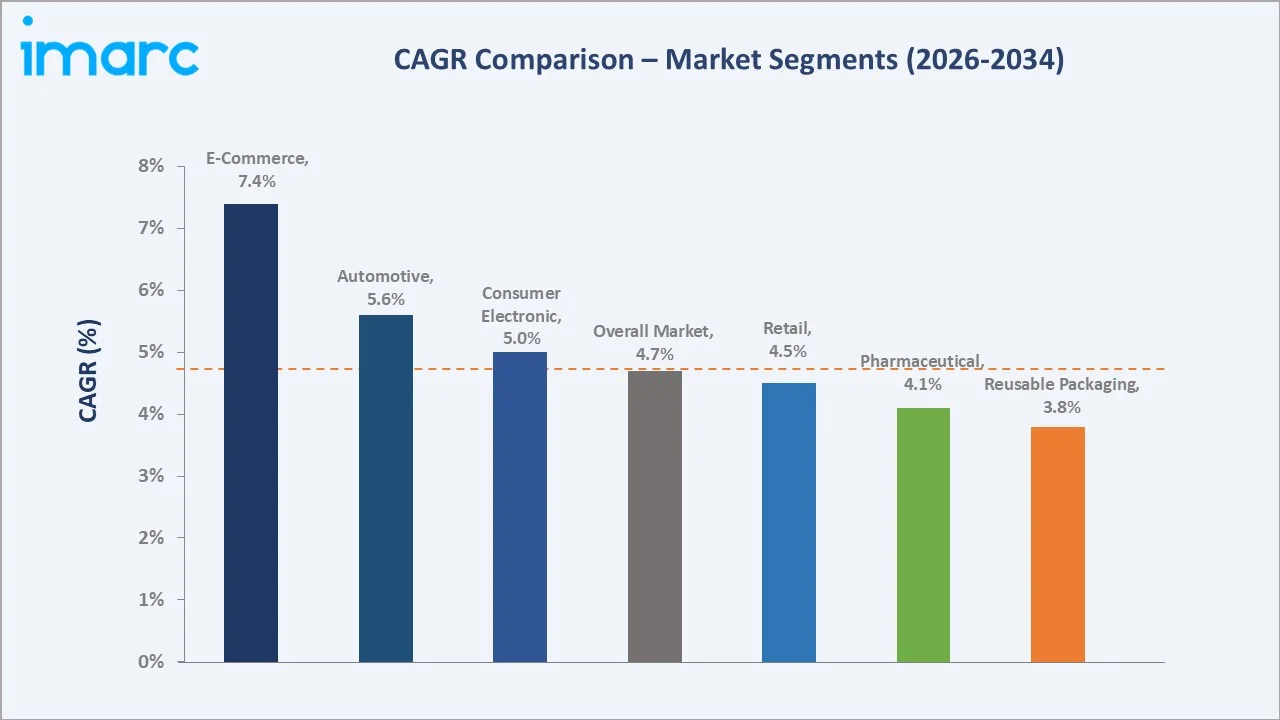
Segment-level CAGR comparisons highlight the dominance of E-Commerce and Automotive as the fastest-growing end-user categories within the global reverse logistics market forecast through 2034.
Executive Summary
The global reverse logistics market is undergoing rapid structural change, shaped by surging e-commerce returns, environmental regulation, and digital transformation in supply chains. Valued at USD 711.1 Billion in 2025, the market is forecast to reach USD 1,076.3 Billion by 2034 at a CAGR of 4.70%. Online retail is the single largest demand pool, with global e-commerce sales surpassing USD 6.3 trillion in 2024 and average online return rates hovering between 16-20%.
Commercial Returns command a 38.6% share in 2025, supported by buyer's remorse, sizing mismatches, and lenient return windows. Repairable Returns account for 22.4%, driven by consumer electronics warranty cycles. By end user, E-Commerce represents 28.5% of global demand, while Automotive is the fastest-growing category at an estimated CAGR of 5.6% through 2030.
Asia-Pacific leads with 36.8% global revenue share in 2025, anchored by China's e-commerce scale and India's growing online retail base. North America holds 28.4% and Europe 22.6%. The reverse logistics market outlook remains positive as AI-led return prediction, blockchain-enabled traceability, and circular-economy compliance converge across all regions.
Key Market Insights
|
Insight |
Data |
|
Largest Return Type |
Commercial Returns – 38.6% share (2025) |
|
Second Return Type |
Repairable Returns – 22.4% share (2025) |
|
Largest End User |
E-Commerce – 28.5% share (2025) |
|
Fastest Growing End User |
Automotive – ~5.6% CAGR (2025-2030) |
|
Leading Region |
Asia-Pacific – 36.8% revenue share (2025) |
|
Top Companies |
United Parcel Service Inc., FedEx Corporation, DB Schenker, C.H. Robinson Worldwide, Yusen Logistics. |
|
Online Returns |
~Expected to exceed $1 Trillion annually |
Key Analytical Observations Supporting the Above Data:
- Commercial Returns' 38.6% dominance in 2025 reflects accelerating e-commerce activity and high online return rates of 16-20%, especially across apparel and consumer electronics in mature markets such as the U.S. and Germany.
- Repairable Returns' 22.4% share is driven by warranty-led repair cycles in consumer electronics, automotive parts, and industrial equipment, with global smartphone repair volumes alone exceeding 1.2 Billion units annually as of 2023.
- E-Commerce end users' 28.5% majority is underpinned by global online retail sales reaching USD 6.3 trillion in 2024, with returns processing emerging as a critical cost center for marketplaces such as Amazon, JD.com, and Shopify-powered retailers.
- Asia-Pacific's 36.8% global dominance reflects China's role as the world's largest e-commerce market, valued at over USD 2.2 trillion in 2023, alongside rapid online retail expansion in India, Indonesia, and Vietnam.
- Sustainability-led demand is reshaping disposition strategy, with EU Waste Framework Directive 2024 amendments and California SB 261 climate disclosure rules pushing brands toward refurbishment, recycling, and reuse pathways.
- Technology investment is accelerating across the value chain, with AI-led return prediction platforms cutting reverse logistics costs by 12-18% and blockchain solutions improving asset visibility for global 3PLs in 2025.
Global Reverse Logistics Market Overview
Reverse logistics covers the planning, execution, and control of product flows from end users back to manufacturers, distributors, or recovery centers. The market spans transportation, warehousing, sorting, refurbishment, recycling, replacement management, and refund authorization across consumer-facing and industrial sectors.
The industry sits at the intersection of e-commerce, sustainability regulation, and supply-chain digitalization. Macroeconomic drivers include rising online retail penetration, stricter extended-producer-responsibility (EPR) frameworks in Europe and Asia-Pacific, and corporate decarbonization commitments. Structurally, the market is shifting from a cost-center model toward a value-recovery and circular-economy model, with refurbished and resold goods generating measurable secondary revenue streams for retailers and OEMs through 2034.
Market Dynamics
To evaluate market opportunities, Request Sample
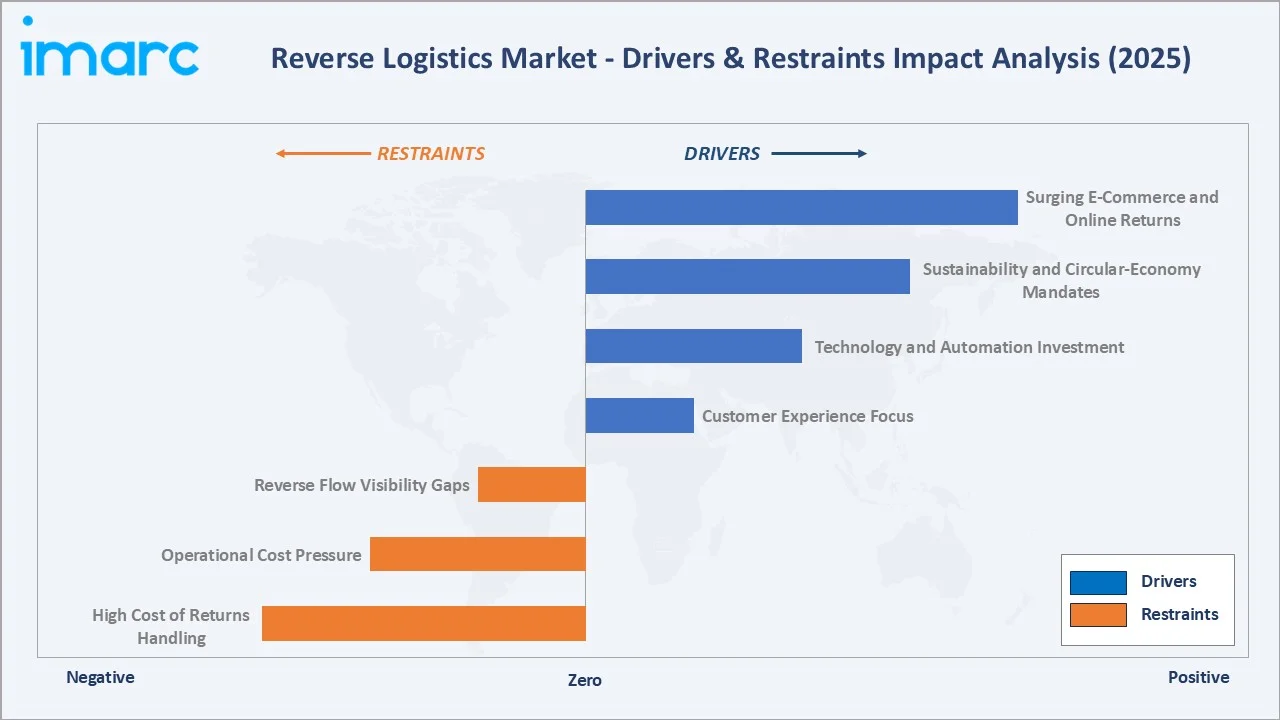
Market Drivers
- Surging E-Commerce and Online Returns: Global e-commerce sales reached USD 6.3 trillion in 2024 and are forecast to cross USD 8 trillion by 2027. With online return rates of 16-20%, retailers are scaling reverse logistics operations to absorb this structural shift.
- Sustainability and Circular-Economy Mandates: Regulatory frameworks such as the EU Circular Economy Action Plan, California SB 343 packaging law, and India's Plastic Waste Management Rules are accelerating recycling, refurbishment, and resale pathways across consumer electronics and FMCG.
- Technology and Automation Investment: AI-led return prediction, blockchain-based traceability, and IoT-enabled asset tracking are reducing reverse logistics costs by 12-18% per shipment for early adopters in 2025, especially across U.S. and EU 3PLs.
- Customer Experience as a Competitive Lever: Studies show 67% of online shoppers check return policy before buying. Frictionless returns are now a primary loyalty driver, prompting retailers to invest in box-free returns, drop-off networks, and instant refunds.
These drivers are converging across mature and emerging economies, transforming reverse logistics from a back-office necessity into a strategic differentiator. Investment in returns infrastructure has grown by an estimated 15-20% annually across leading 3PLs.
Market Restraints
- High Cost of Returns Handling: Reverse logistics typically costs 2-3x more than forward logistics on a per-unit basis, eroding margin for low-ticket e-commerce categories such as fashion and consumables.
- Operational Cost Pressure: Volatile fuel prices, labor shortages in sorting centers, and rising warehousing rents in Tier-1 cities globally are squeezing 3PL margins, particularly across North America and Europe.
- Reverse Flow Visibility Gaps: Many small and mid-size retailers still rely on manual or spreadsheet-based returns tracking, leading to inventory shrinkage and delayed disposition decisions across multi-channel ecosystems.
Market Opportunities
- Specialized Reverse Logistics 3PLs: Pure-play providers such as Happy Returns (acquired by UPS in 2023) and Optoro are scaling rapidly. The specialized returns management software market alone is projected to exceed USD 4 billion by 2028.
- Refurbished and Resale Marketplaces: Resale platforms such as Back Market, ThredUp, and eBay Refurbished are expanding the secondary value of returned goods, with the global recommerce market expected to grow through 2030.
- Emerging Market Penetration: Southeast Asia, India, and the GCC offer significant headroom as e-commerce penetration projected mid-teens by 2030, creating multi-billion-dollar reverse logistics opportunities.
Market Challenges
- Cross-Border Returns Complexity: Customs duties, varying VAT refund rules, and inconsistent labeling standards make international reverse flows costly and slow. EU's Import One-Stop Shop (IOSS) only partially addresses the issue for small-parcel imports.
- Environmental Compliance Burden: The UK’s EPR framework introduces material-specific base fees of ~£192–£461 per tonne, with payments from producers used to fund local authority collection, recycling, and disposal of packaging waste.
- Returns Fraud and Abuse: The U.S. National Retail Federation estimated returns fraud losses at over USD 101 billion in 2023, prompting retailers to tighten policies, charge return fees, and deploy AI-based fraud detection systems.
Emerging Market Trends
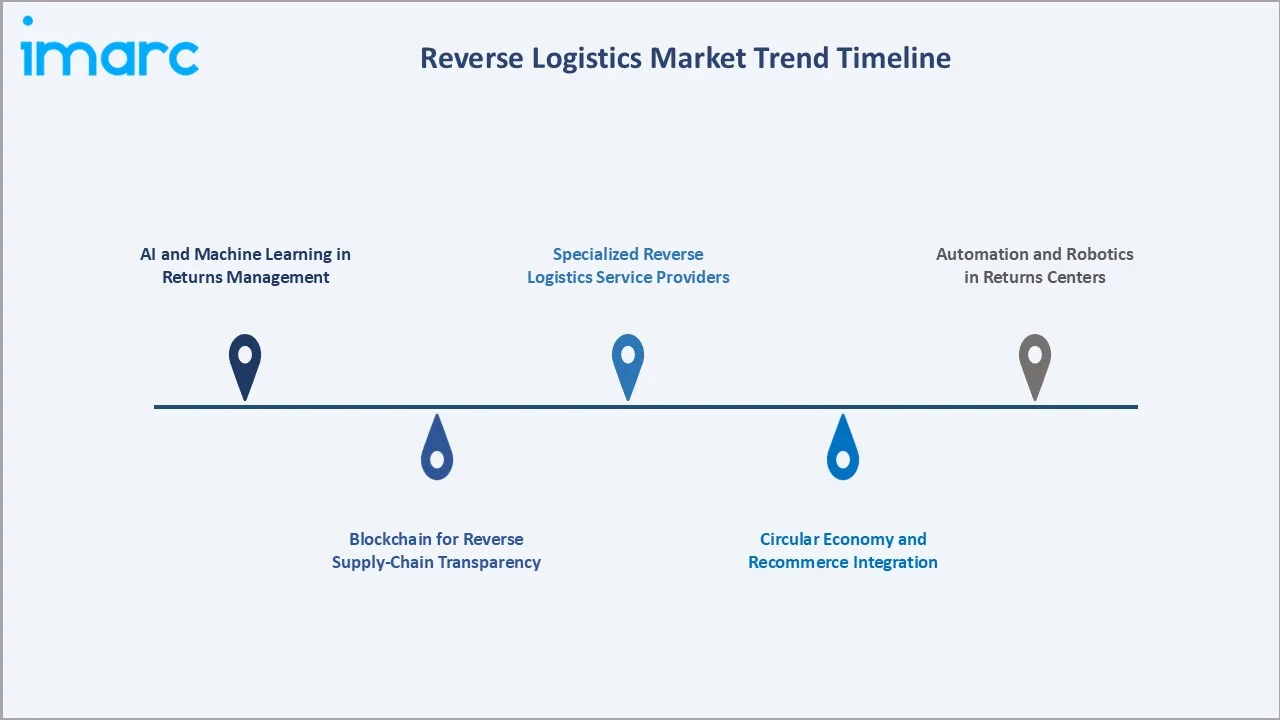
1. AI and Machine Learning in Returns Management
AI-led platforms now predict return probability before checkout, enabling dynamic policies and personalized recommendations. Early adopters report reduction in returns volume and double-digit improvements in disposition routing accuracy through 2025.
2. Blockchain for Reverse Supply-Chain Transparency
Blockchain pilots by IBM, Maersk, and major OEMs are bringing tamper-proof visibility to returns, recalls, and warranty flows. Pharmaceutical and luxury goods are leading verticals, with traceability cycles cut from days to hours in 2024-2025 deployments.
3. Specialized Reverse Logistics Service Providers
Dedicated providers are emerging beyond traditional 3PLs. Happy Returns, Optoro, Reverse Logistics Group, and newRelic-style returns platforms offer end-to-end stack covering refunds, refurbishment, and resale, capturing premium pricing tiers.
4. Circular Economy and Recommerce Integration
Brands such as IKEA, Patagonia, and Apple are formalizing buy-back, trade-in, and resale programs. The global recommerce market is forecast to exceed USD 350 billion by 2030, creating direct demand for sophisticated reverse logistics infrastructure.
5. Automation and Robotics in Returns Centers
Automated sorting, robotic inspection, and computer-vision-based grading are scaling across leading returns hubs. Investment in returns automation reached an estimated USD 2.4 billion globally in 2024 and is forecast to double by 2028.
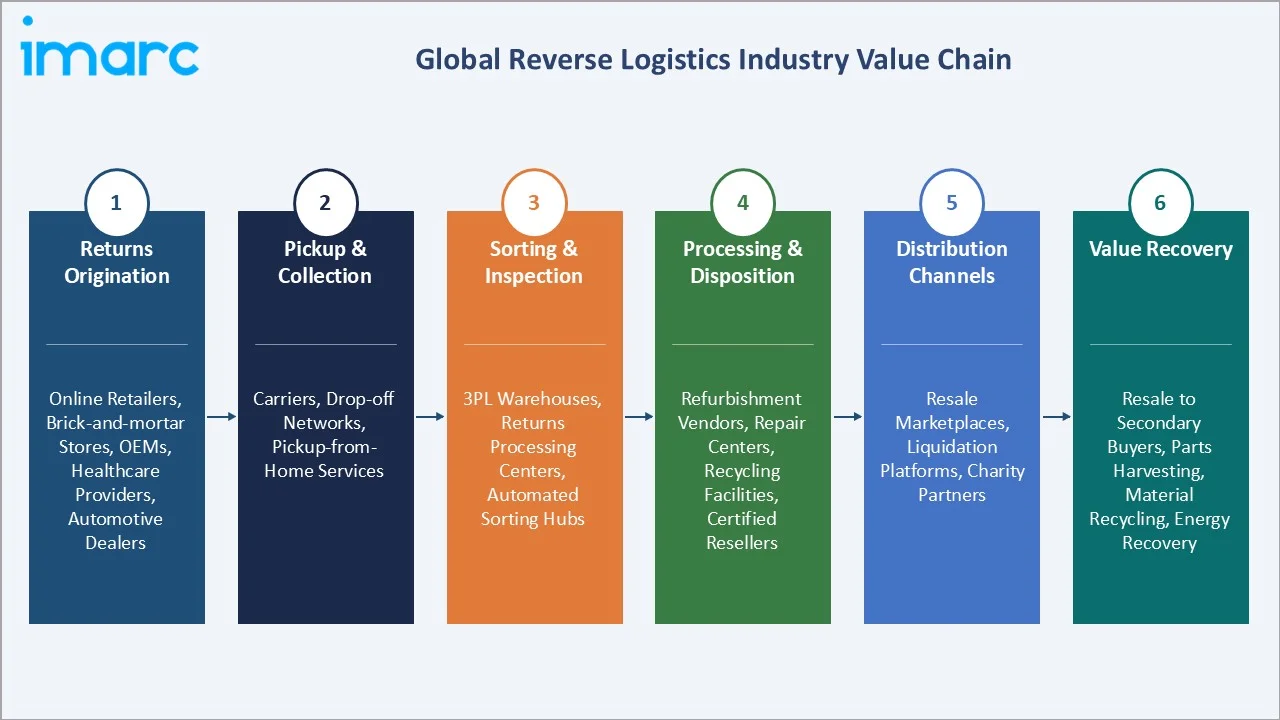
Industry Value Chain Analysis
The reverse logistics value chain spans six integrated stages from returns origination through final value recovery. Each stage has distinct margin profiles, technology investment requirements, and competitive dynamics relevant to the overall reverse logistics market analysis.
|
Value Chain Stage |
Key Participants / Description |
|
Returns Origination |
Online retailers, brick-and-mortar stores, OEMs, healthcare providers, automotive dealers |
|
Pickup & Collection |
Carriers, drop-off networks, pickup-from-home services |
|
Sorting & Inspection |
3PL warehouses, returns processing centers, automated sorting hubs across major hubs |
|
Processing & Disposition |
Refurbishment vendors, repair centers, recycling facilities, certified resellers |
|
Distribution Channels |
Resale marketplaces, liquidation platforms, charity partners |
|
Value Recovery |
Resale to secondary buyers, parts harvesting, material recycling, energy recovery |
Specialized 3PLs and integrated returns-management platforms hold the highest strategic value because they coordinate technology, transportation, and disposition under one stack. Meanwhile, marketplace-driven recommerce is emerging as the highest margin downstream node, with refurbished electronics yielding 40-55% recovery values relative to new-product price.
Technology Landscape in the Reverse Logistics Industry
AI and Predictive Returns Analytics
Machine-learning models now analyze customer behavior, product attributes, and historical return data to forecast return likelihood at the order level. Leading platforms cut returns and route disposition decisions in real time, improving recovery value across e-commerce and apparel categories.
Blockchain and Distributed Ledger
Blockchain solutions provide tamper-proof tracking from return initiation to final disposition. Pharmaceutical, luxury goods, and aerospace sectors are early adopters, using DLT to verify authenticity, manage recalls, and meet regulatory traceability requirements with sub-day audit cycles.
IoT and Real-Time Asset Visibility
RFID tags, GPS trackers, and connected sensors deliver real-time visibility across the reverse flow. Retailers and 3PLs are deploying IoT for returnable transit packaging, reusable containers, and high-value asset returns, cutting loss rates in 2025 deployments.
Automation, Robotics, and Computer Vision
Robotic sorting arms, autonomous mobile robots, and computer-vision grading are reshaping returns processing centers. Vision-based defect detection improves grading accuracy and accelerates throughput by 2-3x compared with manual inspection benchmarks.
Market Segmentation Analysis
IMARC Group provides an analysis of the key trends in each segment of the global reverse logistics market, along with forecasts at the global, regional, and country levels from 2026 to 2034. The market has been categorized based on return type and end user.
The report includes following segments:
|
Segment Category |
Leading Segment |
Market Share |
Year |
|
Return Type |
Commercial Returns |
38.6% |
2025 |
|
Service |
🔒 |
🔒 |
2025 |
|
End User |
E-Commerce |
28.5% |
2025 |
|
Region |
Asia-Pacific |
36.8% |
2025 |

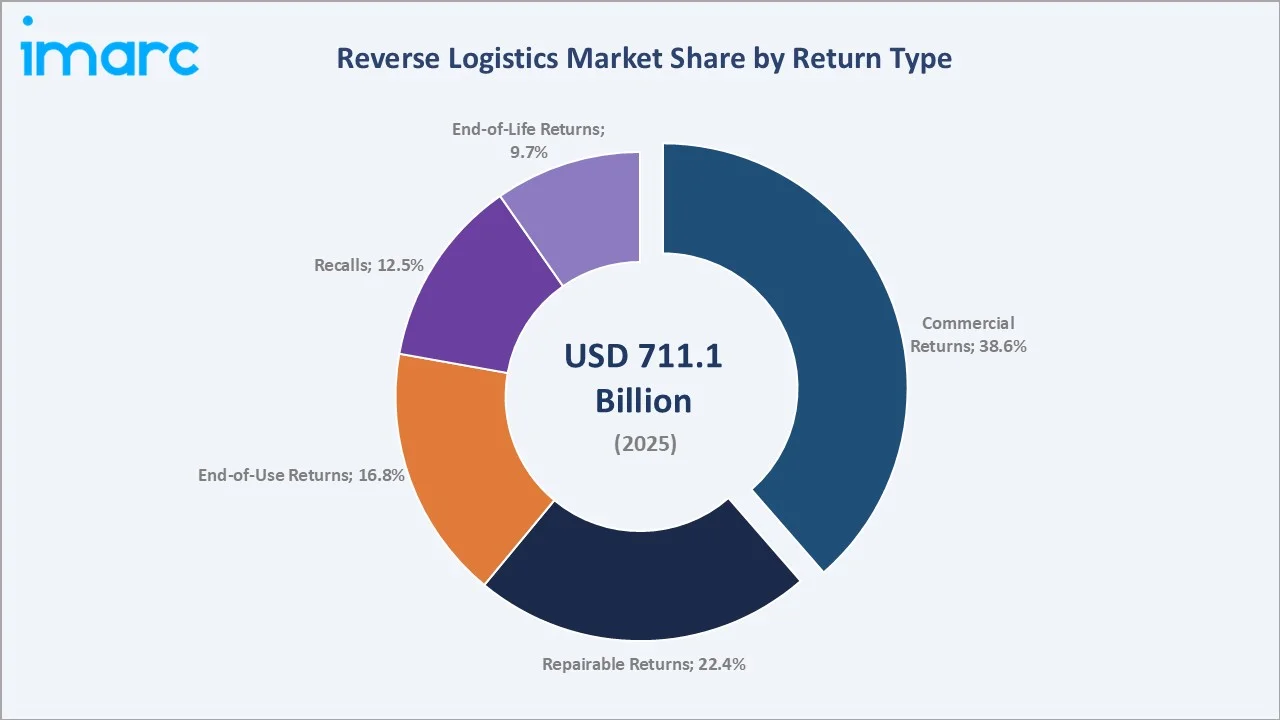
By Return Type
Commercial Returns lead the global reverse logistics market with a 38.6% share in 2025. Demand is driven by high online return rates of 16-20% across e-commerce, especially in apparel, footwear, and consumer electronics. Buyer's remorse, sizing mismatches, and lenient retailer return windows are structural contributors. The category is projected to grow at approximately 4.9% CAGR through 2030 as online retail penetration rises in Asia-Pacific and Latin America.
To access detailed market analysis, Request Sample
Repairable Returns account for 22.4% of global volume, supported by warranty-driven repair cycles in consumer electronics, automotive parts, and industrial equipment. Smartphone repair volumes alone exceed 460 million units annually as of 2024.
End-of-Use Returns (16.8%) include trade-in and buy-back programs from brands such as Apple, Samsung, and IKEA, while Recalls (12.5%) are driven by automotive and food-safety regulatory requirements. End-of-Life Returns (9.7%) cover recycling and disposal of products that reach environmental end-of-life status.
By End User
E-Commerce dominates the global reverse logistics market with a 28.5% share in 2025. The category is fueled by global online retail sales reaching USD 6.3 trillion in 2024, with leading marketplaces such as Amazon, Alibaba, and Shopify-powered retailers operating dedicated returns infrastructure. Box-free drop-off networks, instant refunds, and AI-driven returns prediction are reshaping the cost curve.
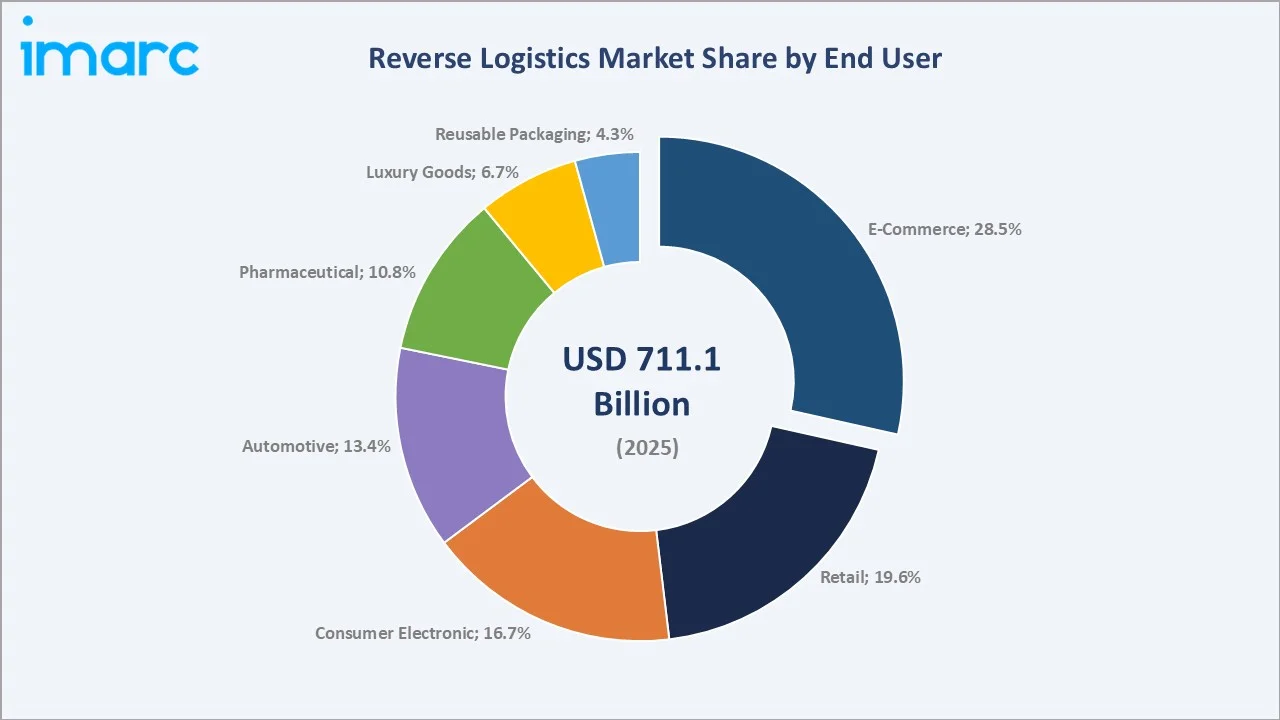
Retail accounts for 19.6% of demand, anchored by omnichannel returns where consumers buy online and return in-store. Consumer Electronic represents 16.7%, supported by warranty and repairable return cycles, while Automotive (13.4%) is driven by recalls, dealer trade-ins, and parts remanufacturing.
Pharmaceutical (10.8%) is shaped by strict expiry, recall, and cold-chain compliance requirements. Luxury Goods (6.7%) and Reusable Packaging (4.3%) round out the segmentation, with reusable packaging emerging as a sustainability-led growth pocket through 2034.
Regional Market Insights
|
Region |
Share (2025) |
Key Growth Drivers |
|
Asia-Pacific |
36.8% |
China e-commerce scale, India online retail boom, Southeast Asia urbanization, automation investment |
|
North America |
28.4% |
Mature e-commerce, returns automation, EPR regulation, dedicated 3PL ecosystem |
|
Europe |
22.6% |
EU Circular Economy Action Plan, Waste Framework Directive, sustainability-led recommerce |
|
Latin America |
7.5% |
Brazil and Mexico e-commerce expansion, growing middle-class online spending |
|
Middle East & Africa |
4.7% |
GCC e-commerce mega-hubs, Saudi Vision 2030 logistics build-out, urbanization in North Africa |
Asia-Pacific commands 36.8% global revenue share in 2025. China is the single most important national market, with e-commerce sales exceeding USD 2.3 trillion in 2024 and rapid scaling of returns infrastructure across Alibaba, JD.com, and Pinduoduo logistics arms. India's online retail market crossed USD 130 billion in 2024 and is forecast to triple by 2030, generating large-scale returns volumes. Southeast Asia, led by Indonesia and Vietnam, is contributing further volume through Shopee, Lazada, and TikTok Shop activity. Asia-Pacific is also forecast to be the fastest-growing region, advancing at approximately 5.4% CAGR through 2034.
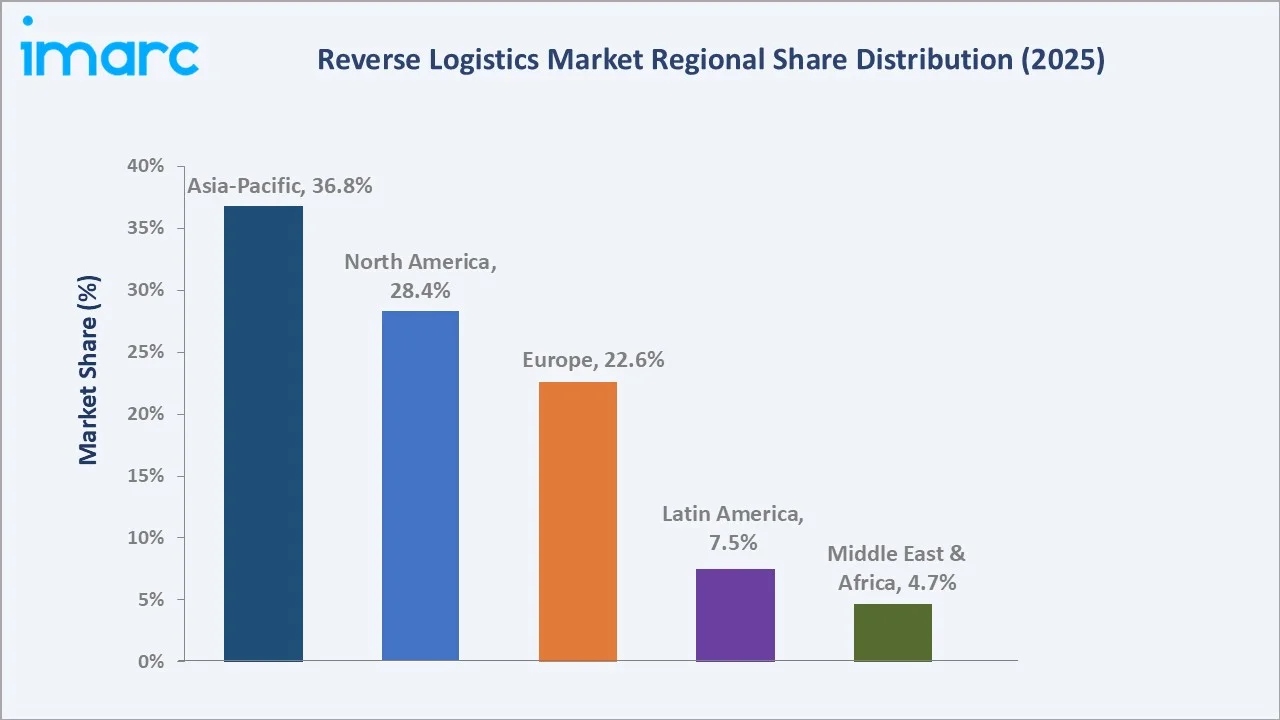
North America holds 28.4% of global revenue, anchored by U.S. e-commerce sales surpassing USD 1.1 trillion in 2024. UPS's acquisition of Happy Returns in 2023, FedEx-Delhivery partnership extensions, and growing returns automation investment across major 3PLs are key catalysts. Returns fraud losses estimated at USD 101 billion in 2023 are also driving rapid investment in AI-based detection and stricter return-policy frameworks.
Europe holds 22.6%, led by Germany, the UK, and France. The EU Circular Economy Action Plan, Waste Framework Directive amendments, and Right to Repair Directive 2024 are structural growth catalysts. The Middle East and Africa represent 4.7%, driven by GCC e-commerce mega-hubs, Saudi Vision 2030 logistics investment, and Dubai's role as a regional re-export center. Latin America accounts for 7.5%, led by Brazil and Mexico, where online retail penetration is rising rapidly across Mercado Libre, Magazine Luiza, and Amazon Brazil networks.
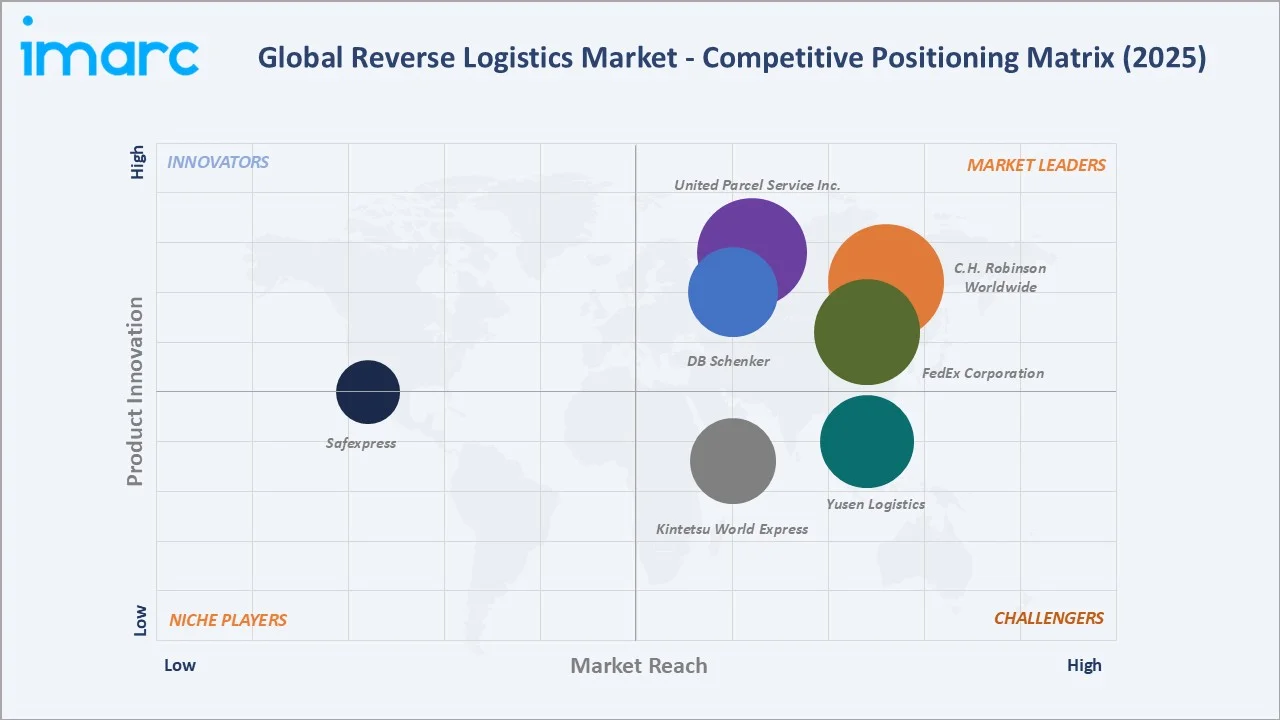
Competitive Landscape
|
Company Name |
Key Brand / Platform |
Market Position |
Core Strength |
|
United Parcel Service Inc. |
Happy Returns |
Leader |
Box-free returns network, global parcel reach |
|
FedEx Corporation |
FedEx |
Leader |
Global air-ground network, healthcare reverse logistics |
|
DB Schenker |
DB Schenker |
Leader |
European leadership, contract logistics depth |
|
C.H. Robinson Worldwide |
C.H. Robinson |
Leader |
Tech-enabled brokerage, North America scale |
|
Yusen Logistics |
Yusen Logistics |
Challenger |
Asia-Pacific reach, automotive reverse flows |
|
Kintetsu World Express |
KWE |
Challenger |
Japan-anchored network, electronics expertise |
|
Safexpress |
Safexpress |
Emerging |
India-led network, e-commerce specialization |
The global reverse logistics market is moderately fragmented. Global parcel networks compete alongside contract logistics specialists, regional players, and a fast-emerging cohort of pure-play returns platforms. Leading providers compete on technology integration, geographic reach, sustainability credentials, and depth of disposition partnerships. Strategic acquisitions are a recurring feature - UPS's acquisition of Happy Returns in 2023 and FedEx's partnership with Delhivery in 2021 are landmark examples reshaping competitive intensity.
Key Company Profiles
United Parcel Service, Inc
United Parcel Service is one of the world's largest parcel and logistics companies, headquartered in Atlanta, Georgia. Founded in 1907, UPS operates across 220+ countries and territories, serving e-commerce, healthcare, industrial, and SMB customers.
- Product & Platform Portfolio: UPS's reverse logistics offering spans UPS Returns, UPS Returns Plus, Print Return Label, and the Happy Returns drop-off network acquired in 2023, which provides box-free returns at over 12,000 locations.
- Recent Developments: In October 2023, UPS acquired Happy Returns to scale its returns ecosystem and expand its consumer drop-off network across U.S. retail.
- Strategic Focus: UPS's strategy centers on integrating Happy Returns into its core network, scaling box-free returns globally, and expanding healthcare reverse logistics, a high-margin growth vertical through 2030.
FedEx Corporation
FedEx Corporation, headquartered in Memphis, Tennessee, is a global leader in transportation, e-commerce, and business services. Founded in 1971, the company serves customers across more than 220 countries and territories with integrated air-ground networks.
- Product & Platform Portfolio: FedEx's reverse logistics suite includes FedEx Returns Technology, FedEx Reverse Logistics, healthcare-focused Critical Inventory Logistics (CIL), and an integrated supply chain platform supporting recalls, repair returns, and refurbishment flows.
- Recent Developments: In 2025, FedEx launched “FedEx Easy Returns,” a box-free, label-free returns solution across ~3,000 locations, aimed at improving efficiency and reducing costs in e-commerce reverse logistics.
- Strategic Focus: FedEx is focused on scaling cross-border returns, deepening healthcare reverse logistics, and leveraging Network 2.0 transformation to integrate forward and reverse flows under a unified ground operation.
DB Schenker
DB Schenker is the logistics arm of Deutsche Bahn AG, headquartered in Essen, Germany. The company is one of the world's leading contract logistics and freight forwarding providers, with operations across 130+ countries.
- Product & Platform Portfolio: DB Schenker offers integrated reverse logistics services including returns processing, repair management, refurbishment, and end-of-life disposition, supported by its eSchenker digital platform and connect 4.0 IoT visibility tools.
- Recent Developments: In 2024, DB Schenker continued investing in automated sorting and logistics infrastructure across Europe, with individual hubs (e.g., Paris) delivering ~25% capacity improvements, supporting growing e-commerce volumes.
- Strategic Focus: Following the agreement for acquisition by DSV in 2024, DB Schenker is focused on scale-driven contract logistics consolidation, automation in reverse logistics centers, and sustainability-led service offerings across Europe and Asia-Pacific.
Market Concentration Analysis
The global reverse logistics market exhibits moderate fragmentation. The top five players - UPS, FedEx, DB Schenker, C.H. Robinson, and Yusen Logistics - collectively account for 28-34% of global market revenue in 2025. The remaining share is distributed across regional 3PLs, specialized returns platforms such as Happy Returns and Optoro, EPR specialists like RLG, and a long tail of country-level providers.
The market is undergoing structural consolidation at the premium tier, with global parcel networks acquiring pure-play returns specialists to capture digital-native demand. Concurrently, regional players in India, Southeast Asia, and Latin America are scaling rapidly to serve local e-commerce ecosystems. This dual dynamic is intensifying competition across price tiers and geographies through 2034.
Investment & Growth Opportunities
Fastest-Growing Segments
E-Commerce reverse logistics is the highest-growth end-user category, expanding at approximately 6.0% CAGR through 2030, supported by online retail penetration in emerging markets. Automotive reverse logistics is projected to grow at 5.6% CAGR, anchored by recalls, EV battery returns, and parts remanufacturing. Specialized returns management software is the premium technology growth opportunity, with the global market expected to exceed USD 4 billion by 2028.
Emerging Market Expansion
India represents the highest-potential emerging market, with online retail crossing USD 130 billion in 2024 and forecast to triple by 2030. Southeast Asia's Shopee-Lazada-TikTok Shop ecosystem, GCC e-commerce mega-hubs, and Brazil's accelerating online retail base collectively offer multi-billion-dollar reverse logistics opportunities through 2034.
Venture and Strategic Investment Trends
Strategic acquisitions are reshaping the competitive landscape. UPS acquired Happy Returns in October 2023 to extend its drop-off network. Returns-management software companies including Loop Returns, Returnly, and Narvar have collectively raised over USD 800 million in venture funding since 2020. AI-led returns optimization, blockchain-based traceability, and circular-economy platforms remain the primary focus areas for venture and corporate capital through 2034.
Future Market Outlook (2026-2034)
The global reverse logistics market forecast projects steady value expansion from USD 711.1 Billion in 2025 to USD 1,076.3 Billion by 2034 at a CAGR of 4.70%. Asia-Pacific will retain regional leadership while accelerating structurally. North America and Europe will sustain premium-value growth through automation, EPR compliance, and circular-economy investment cycles.
Three key shifts will reshape the reverse logistics market through 2034. First, AI and machine learning will move from pilot to standard practice, embedded across return prediction, disposition routing, and fraud detection. Second, sustainability regulation will tighten globally, mandating refurbishment, repair, and recycling pathways for a growing list of categories. Third, specialized reverse logistics platforms will scale into a USD 10+ billion software-led sub-sector, intensifying competition with traditional parcel-led 3PLs through the forecast horizon.
Research Methodology
Primary Research
Primary research encompassed structured interviews conducted in 2024-2025 with stakeholders including supply chain directors at e-commerce retailers, vice presidents of logistics at parcel carriers, returns operations heads at 3PLs, and institutional investors in supply-chain technology. Primary insights validated market sizing, segmentation estimates, and technology adoption timelines across regions.
Secondary Research
Secondary sources include U.S. Census Bureau e-commerce data, National Retail Federation returns reports, EU Eurostat circular-economy indicators, OECD logistics data, company annual reports, trade publications such as Supply Chain Dive, Logistics Management, and Reverse Logistics Magazine, and government policy publications across regulated markets.
Forecasting Models
Market size estimations and growth projections were derived using a combination of top-down and bottom-up forecasting models, incorporating GDP growth rates, e-commerce penetration indices, returns-rate benchmarks, and historical market evolution patterns. Scenario analysis (base, optimistic, and conservative cases) was performed to account for macroeconomic uncertainty across the 2026-2034 forecast horizon.
Report Coverage
|
Report Feature |
Details |
|
Base Year |
2025 |
|
Historical Period |
2020-2025 |
|
Forecast Period |
2026-2034 |
|
Units |
USD Billion |
|
Segments Covered |
Return Type, Service, End User, Region |
|
Regions Covered |
Asia-Pacific, North America, Europe, Latin America, Middle East & Africa |
|
Countries Covered |
USA, Canada, Germany, France, UK, Italy, Spain, Russia, China, Japan, India, South Korea, Australia, Indonesia, Brazil, Mexico |
|
Customization Scope |
10% free customization |
|
Report Delivery |
PDF and Excel through Email (10-12 week support) |
Key Benefits for Stakeholders:
- IMARC’s industry report offers a comprehensive quantitative analysis of various market segments, historical and current market trends, market forecasts, and dynamics of the reverse logistics market from 2020-2034.
- The research report provides the latest information on the market drivers, challenges, and opportunities in the global reverse logistics market.
- The study maps the leading, as well as the fastest-growing, regional markets. It further enables stakeholders to identify the key country-level markets within each region.
- Porter's five forces analysis assists stakeholders in assessing the impact of new entrants, competitive rivalry, supplier power, buyer power, and the threat of substitution. It helps stakeholders to analyze the level of competition within the reverse logistics industry and its attractiveness.
- The competitive landscape allows stakeholders to understand their competitive environment and provides insight into the current positions of key players in the market.
Frequently Asked Questions About the Reverse Logistics Market Report
The global reverse logistics market was valued at USD 711.1 Billion in 2025, driven by e-commerce returns, sustainability mandates, and accelerating adoption of AI-led returns management platforms worldwide.
The market is projected to reach USD 1,076.3 Billion by 2034, growing at a CAGR of 4.70% during 2026-2034, supported by online retail expansion, automation, and circular-economy adoption.
Commercial Returns lead with a 38.6% share in 2025, driven by high online return rates of 16-20% across e-commerce, lenient return policies, and rising buyer's remorse in fashion and electronics.
Automotive is among the fastest-growing end-user categories, expanding at an estimated CAGR of 5.6% through 2030, driven by recalls, EV battery returns, and parts remanufacturing programs.
Asia-Pacific dominates with a 36.8% share in 2025. China's e-commerce scale, India's online retail boom, and Southeast Asia's marketplace expansion underpin its leadership in the global market.
Key drivers include e-commerce returns surge, sustainability and circular-economy mandates, technology and automation investment, EPR regulation, and customer experience emphasis among online retailers globally.
Major players include United Parcel Service Inc., FedEx Corporation, DB Schenker, C.H. Robinson Worldwide, Yusen Logistics, Kintetsu World Express, Safexpress.
AI and machine learning lead technology growth, advancing rapidly through 2030 as platforms enable return prediction, disposition routing, fraud detection, and 12-18% reverse logistics cost reduction for early adopters.
Key opportunities include AI-led returns platforms, blockchain traceability solutions, India and Southeast Asia expansion, refurbishment and recommerce marketplaces, and automation in returns processing centers.
Sustainability is a primary growth lever, with EU Circular Economy Action Plan, EPR frameworks, and corporate decarbonization commitments accelerating refurbishment, recycling, and reuse pathways across all major industry verticals.
E-commerce is the single largest demand driver, with global online sales surpassing USD 6.3 trillion in 2024 and online return rates of 16-20% generating structural demand for scalable reverse logistics solutions.
Key challenges include high cost of returns handling, returns fraud (USD 101 billion in 2023), cross-border complexity, EPR compliance burden, and operational pressures from labor shortages and warehousing costs.
Need more help?
- Speak to our experienced analysts for insights on the current market scenarios.
- Include additional segments and countries to customize the report as per your requirement.
- Gain an unparalleled competitive advantage in your domain by understanding how to utilize the report and positively impacting your operations and revenue.
- For further assistance, please connect with our analysts.
 Request Customization
 Speak to an Analyst
 Request Brochure
 Inquire Before Buying
Benefits of Customization
- Personalize this research
- Triangulate with your data
- Get data as per your format and definition
- Gain a deeper dive into a specific application, geography, customer, or competitor
- Any level of personalization
Get in Touch With Us
UNITED STATES
Phone: +1-201-971-6302
INDIA
Phone: +91-120-433-0800
UNITED KINGDOM
Phone: +44-753-714-6104
Email: [email protected]
Client Testimonials


.webp)


