
Paracetamol Prices, Trend, Chart, Demand, Market Analysis, News, Historical and Forecast Data Report 2026 Edition
Paracetamol Price Trend, Index and Forecast
Track the latest insights on paracetamol price trend and forecast with detailed analysis of regional fluctuations and market dynamics across North America, Latin America, Central Europe, Western Europe, Eastern Europe, Middle East, North Africa, West Africa, Central and Southern Africa, Central Asia, Southeast Asia, South Asia, East Asia, and Oceania.
Paracetamol Prices Outlook Q1 2026
- USA: USD 3645/MT
- China: USD 3554/MT
- Germany: USD 3623/MT
- India: USD 3031/MT
- France: USD 3991/MT
Paracetamol Price Chart

Get real-time access to monthly/quarterly/yearly prices Request Sample
During the first quarter of 2026, the paracetamol prices in the USA reached 3645 USD/MT in March. Prices moved upward from the previous quarter as buying interest improved across pharmaceutical formulation units. Demand from over the counter medicine producers remained firm, supported by steady consumption of pain relief and fever management products. Feedstock availability was manageable, yet suppliers maintained stronger offers due to firm production costs and improved export inquiries.
During the first quarter of 2026, the paracetamol prices in China reached 3554 USD/MT in March. Prices increased as domestic and export demand strengthened. Pharmaceutical manufacturers maintained active procurement to meet formulation requirements, while overseas inquiries improved from major consuming markets. Producers adjusted offers upward due to firmer feedstock costs and better order visibility. Supply remained adequate, yet sellers avoided aggressive discounts as inventories were balanced.
During the first quarter of 2026, the paracetamol prices in Germany reached 3623 USD/MT in March. Prices rose as pharmaceutical demand improved across the domestic market and nearby European destinations. Buyers showed stronger interest in securing material for medicine production, supported by steady demand from analgesic and antipyretic formulations. Import costs remained firm, and suppliers passed higher procurement expenses into market offers. Inventory levels were not excessive, which limited room for price negotiation.
During the first quarter of 2026, the paracetamol prices in India reached 3031 USD/MT in March. Prices increased as domestic pharmaceutical demand improved and export inquiries remained active. Formulation producers maintained steady procurement for pain relief and fever treatment medicines. Feedstock related costs were firm, prompting producers to raise offers in line with improved market sentiment. Supply availability was sufficient, but sellers avoided large discounts due to better buying activity.
During the first quarter of 2026, the paracetamol prices in France reached 3991 USD/MT in March. Prices moved higher as pharmaceutical demand strengthened and import offers remained firm. Buyers from formulation and distribution channels maintained regular procurement due to steady consumption of analgesic and antipyretic medicines. Supply from overseas producers was available, yet replacement costs stayed elevated, encouraging suppliers to lift quotations.
Paracetamol Prices Outlook Q4 2025
- USA: USD 3418/MT
- China: USD 3332/MT
- Germany: USD 3379/MT
- India: USD 2856/MT
- France: USD 3703/MT
During the fourth quarter of 2025, the paracetamol prices in the USA reached 3418 USD/MT in December. Prices moved downward due to sustained inventory availability across pharmaceutical distributors and subdued downstream procurement from OTC drug manufacturers. Reduced seasonal illness intensity weakened short-term demand sentiment, while stable domestic production levels limited any supply-side pressure. Additionally, improved logistics efficiency and smoother raw material procurement reduced cost escalation risks.
During the fourth quarter of 2025, the paracetamol prices in China reached 3332 USD/MT in December. The market experienced downward pressure driven by ample manufacturing output and weaker export demand. Chinese producers maintained steady operating rates, resulting in comfortable stock levels. Soft international inquiries and aggressive price competition from alternative sourcing regions weighed on export margins.
During the fourth quarter of 2025, the paracetamol prices in Germany reached 3379 USD/MT in December. Prices declined amid restrained pharmaceutical manufacturing activity and adequate supply coverage through long-term contracts. Weak procurement interest from formulation units reduced spot market liquidity. Import availability remained sufficient, preventing any supply tightness. Additionally, downstream buyers delayed replenishment cycles due to inventory optimization strategies.
During the fourth quarter of 2025, the paracetamol prices in India reached 2856 USD/MT in December. The decline was primarily influenced by strong domestic production capacity and reduced export momentum. Pharmaceutical manufacturers maintained steady output, leading to comfortable inventory positions. Export inquiries softened due to increased global competition and price sensitivity among buyers.
During the fourth quarter of 2025, the paracetamol prices in France reached 3703 USD/MT in December. Prices softened due to weaker downstream pharmaceutical demand and adequate import availability. Inventory levels remained sufficient across distribution channels, limiting urgency in procurement. Export demand from neighboring regions declined, reducing market liquidity. Additionally, stable operating conditions and the absence of supply disruptions prevented cost-driven price support.
Paracetamol Prices Outlook Q3 2025
- USA: USD 3573/MT
- China: USD 3415/MT
- Germany: USD 3496/MT
- India: USD 2911/MT
- France: USD 3787/MT
During the third quarter of 2025, the paracetamol prices in the USA reached 3573 USD/MT in September. Prices decreased as purchasing slowed across formulation plants adjusting to shifts in over-the-counter consumption patterns. Suppliers aligned operating schedules with feedstock availability, while distributors managed rising transport premiums across major interstate corridors. These conditions influenced how buyers structured delivery cycles within the domestic market.
During the third quarter of 2025, the paracetamol prices in China reached 3415 USD/MT in September. Market values eased as procurement became more deliberate among bulk pharmaceutical manufacturers. Producers adjusted processing intensity in response to controlled inventories, and exporters navigated varied container availability across major coastal terminals. Regional transport planning also shifted due to route-specific congestion tied to internal freight hubs.
During the third quarter of 2025, the paracetamol prices in Germany reached 3496 USD/MT in September. Values eased as buyers moderated purchasing in response to stable but measured formulation activity. Import-oriented procurement involved navigating documentation standards that varied across European suppliers. Inland transport demand on key German corridors influenced shipment timing for bulk distributors.
During the third quarter of 2025, the paracetamol prices in India reached 2911 USD/MT in September. Prices edged down as formulation units operated with calibrated raw-material intake. Producers balanced run rates with intermediate availability, and domestic transport networks faced seasonal variability that shaped timing for bulk deliveries. Buyers also coordinated replenishment cycles around fluctuating warehouse capacity across major industrial zones.
During the third quarter of 2025, the paracetamol prices in France reached 3787 USD/MT in September. Market levels moved lower as pharmaceutical processors moderated purchasing volumes. Import workflows across western and southern ports followed differing clearance routines, prompting buyers to stagger shipments. Inland distribution choices were also shaped by regulatory requirements linked to traceability within the French pharmaceutical supply chain.
Paracetamol Prices Outlook Q2 2025
- USA: USD 3821/MT
- China: USD 3732/MT
- Germany: USD 3767/MT
- India: USD 2958/MT
- France: USD 3965/MT
During the second quarter of 2025, the paracetamol prices in the USA reached 3821 USD/MT in June. In the USA, paracetamol prices in Q2 2025 were influenced by rising demand from the over-the-counter medicine segment due to seasonal consumption trends. Import dependency on Asian suppliers created vulnerabilities amid extended shipping lead times and higher ocean freight costs. Additionally, regulatory reviews on pharmaceutical ingredients and limited local active pharmaceutical ingredient (API) production added supply-side constraints for domestic formulators.
During the second quarter of 2025, paracetamol prices in China reached 3732 USD/MT in June. In China, paracetamol pricing was impacted by elevated raw material costs, particularly for para-aminophenol, as well as stricter environmental compliance requirements for chemical manufacturing units. The quarter also saw scheduled maintenance activities at key API production facilities, leading to temporary capacity reductions. Growing domestic demand from the healthcare and export formulation sectors further tightened inventory levels available for the bulk drug market.
During the second quarter of 2025, the paracetamol prices in Germany reached 3767 USD/MT in June. In Germany, paracetamol prices were affected by steady demand from the pharmaceutical and hospital procurement sectors. Challenges in securing timely API shipments from India and China, compounded by European port delays and container shortages, impacted formulation schedules. Regulatory lead times for raw material certification and limited spot availability from regional distributors added procurement uncertainty across pharmaceutical supply chains.
During the second quarter of 2025, the paracetamol prices in India reached 2958 USD/MT in June. In India, pricing dynamics for paracetamol were driven by fluctuating input costs for key intermediates and variable demand from both domestic and export-oriented formulation units. Temporary disruptions at chemical manufacturing clusters due to environmental audits reduced production efficiency. Additionally, currency volatility affected import costs for upstream chemicals not locally sourced, while high inventory turnover among generic drug producers influenced procurement cycles.
During the second quarter of 2025, the paracetamol prices in France reached 3965 USD/MT in June. In France, paracetamol pricing trends were influenced by consistent consumption from the public healthcare sector and pharmacies. Import delays of key APIs from Asia, especially China, disrupted formulation timelines for contract manufacturers. Local production was constrained by limited surplus capacity and longer quality assurance cycles. Rising packaging and energy costs during the quarter also exerted upward pressure on finished product costs.
Regional Coverage
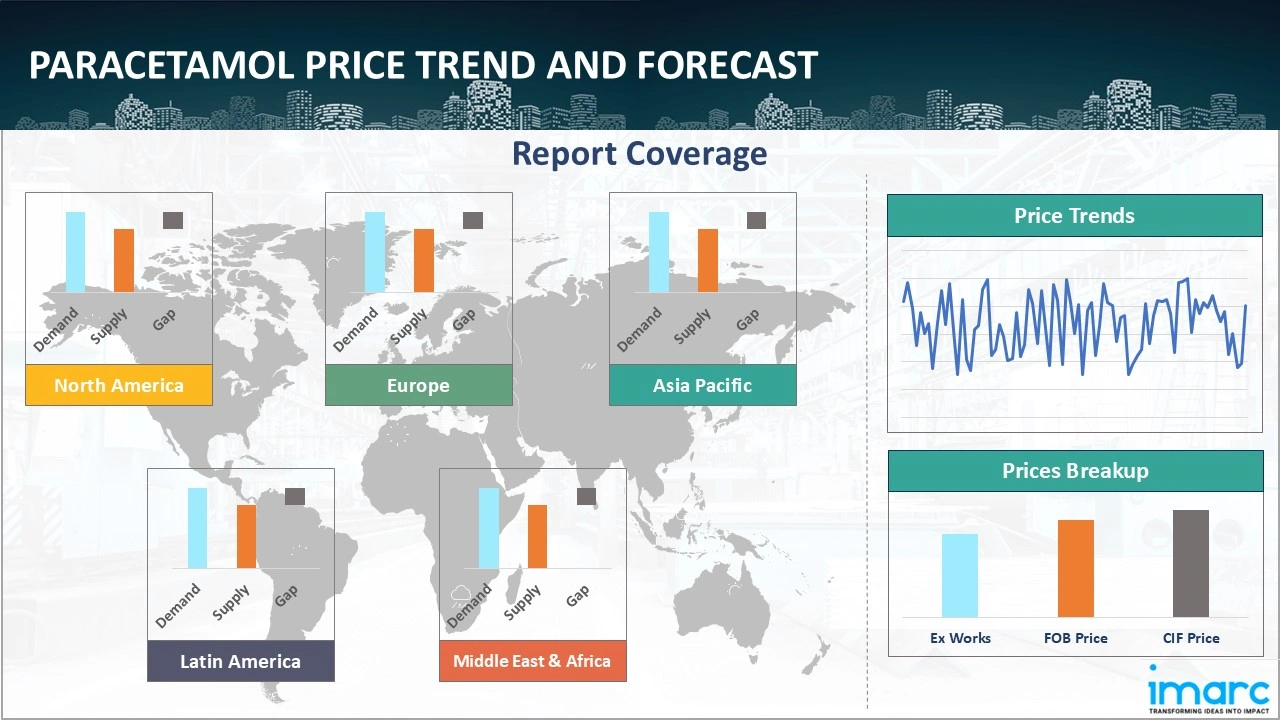
The report provides a detailed analysis of the market across different regions, each with unique pricing dynamics influenced by localized market conditions, supply chain intricacies, and geopolitical factors. This includes price trends, price forecast and supply and demand trends for each region, along with spot prices by major ports. The report also provides coverage of FOB and CIF prices, as well as the key factors influencing paracetamol prices.
Europe Paracetamol Price Trend
Q1 2026:
Paracetamol price index in Europe moved upward as pharmaceutical demand improved and import replacement costs stayed firm. Formulation producers increased procurement for analgesic and antipyretic medicines, while distributors focused on maintaining adequate inventories. Supplier offers strengthened due to firmer raw material costs and better downstream order flow. Germany and France reflected this positive market tone, with prices rising as buyers returned to regular procurement. Supply availability was steady, yet sellers resisted discounts because stock pressure was limited.
Q4 2025:
The paracetamol price index in Europe reflected a sustained declining trend primarily due to subdued pharmaceutical manufacturing activity across major consuming countries. Demand from formulation units weakened as healthcare consumption normalized, prompting buyers to rely on existing inventories rather than fresh procurement. Regional supply remained ample, supported by stable domestic production and uninterrupted import flows from key exporting countries.
Q3 2025:
As per the paracetamol price index, European prices trended downward as pharmaceutical manufacturers adopted more measured procurement across major production hubs. Northern European processing sites synchronized operating rhythms with compliance-driven adjustments, while Southern European importers balanced shipments across short-sea routes with varied port efficiency. Differences in supplier qualification procedures across EU markets shaped sourcing decisions. Rail and road availability also shifted across regional corridors, guiding how distributors organized deliveries within the continent.
Q2 2025:
As per the paracetamol price index, European paracetamol prices in Q2 2025 were influenced by consistent demand from the pharmaceutical, hospital, and consumer healthcare sectors. Supply chain disruptions stemming from delayed API shipments from Asia and ongoing logistics bottlenecks across key European ports created procurement uncertainty. Additionally, rising energy and compliance costs for local drug manufacturers and a limited number of EU-based API producers contributed to tighter market conditions for formulators and distributors.
This analysis can be extended to include detailed paracetamol price information for a comprehensive list of countries.
| Region | Countries Covered |
|---|---|
| Europe | Germany, France, United Kingdom, Italy, Spain, Russia, Turkey, Netherlands, Poland, Sweden, Belgium, Austria, Ireland, Switzerland, Norway, Denmark, Romania, Finland, Czech Republic, Portugal, and Greece, among other European countries. |
North America Paracetamol Price Trend
Q1 2026:
Paracetamol price index in North America strengthened as demand from pharmaceutical and over the counter medicine producers improved. Buyers increased procurement after earlier cautious purchasing, supporting stronger supplier offers. Import costs remained firm, and sellers passed higher procurement expenses into the market. Inventory positions were balanced, which reduced the need for discounting. The USA market reflected this upward trend as demand recovered and formulation activity remained steady. Logistics were largely stable, but they did not offset cost pressure from suppliers. Market sentiment improved as downstream users secured material for regular production cycles.
Q4 2025:
The paracetamol price index in North America softened as downstream pharmaceutical demand moderated following earlier seasonal peaks. Reduced healthcare-related consumption weakened procurement momentum among OTC drug manufacturers and distributors. Inventory levels across the region remained sufficient, allowing buyers to delay purchases and prioritize stock optimization strategies. Domestic production operated steadily, while import availability remained consistent, preventing any supply-side tightness.
Q3 2025:
As per the paracetamol price index, North American prices moved lower as healthcare distributors fine-tuned purchasing to reflect moderate demand in both prescription and OTC channels. Gulf Coast facilities managed berth allocations amid overlapping pharmaceutical ingredient movements, while Midwest hubs encountered irregular trucking capacity tied to labor rotation cycles. Canadian buyers navigated compliance checks at border points, affecting scheduling for inbound material. Storage constraints in several inland centers shaped inventory timing across the region.
Q2 2025:
As per the paracetamol price index, in North America, paracetamol pricing was shaped by steady over-the-counter (OTC) medicine demand, combined with continued reliance on imported APIs, primarily from China and India. Prolonged ocean transit times, higher freight charges, and stricter regulatory scrutiny on imported pharmaceutical ingredients influenced inventory planning. Moreover, limited domestic API manufacturing capacity and increased safety stock procurement by major drug retailers impacted sourcing dynamics across both the USA and Canada.
Specific paracetamol historical data within the United States and Canada can also be provided.
| Region | Countries Covered |
|---|---|
| North America | United States and Canada |
Middle East and Africa Paracetamol Price Trend
Q1 2026:
The study examines the Middle East and Africa's paracetamol pricing trends and chart, taking into account variables that specifically affect market prices, such as regional industrial expansion, the availability of natural resources, and geopolitical conflicts.
Q4 2025:
The report explores the paracetamol pricing trends and paracetamol price chart in the Middle East and Africa, considering factors like regional industrial growth, the availability of natural resources, and geopolitical tensions that uniquely influence market prices.
Q3 2025:
As per paracetamol price chart, the prices in the Middle East and Africa fluctuated due to a complex interplay of factors, primarily driven by supply chain disruptions, seasonal demand shifts, and geopolitical influences.
In addition to region-wise data, information on paracetamol prices for countries can also be provided.
| Region | Countries Covered |
|---|---|
| Middle East & Africa | Saudi Arabia, UAE, Israel, Iran, South Africa, Nigeria, Oman, Kuwait, Qatar, Iraq, Egypt, Algeria, and Morocco, among other Middle Eastern and African countries. |
Asia Pacific Paracetamol Price Trend
Q1 2026:
In the Asia Pacific, paracetamol prices increased as demand improved across major pharmaceutical manufacturing hubs. China and India showed stronger market sentiment due to active formulation demand and better export inquiries. Producers raised offers as feedstock costs remained firm and order books improved. Buyers returned to regular procurement after previous destocking, supporting stronger trade activity. Supply remained adequate, yet sellers avoided aggressive pricing due to balanced inventories. Export demand from regulated and emerging markets also supported the regional price trend.
Q4 2025:
The Asia Pacific paracetamol market experienced declining prices due to strong production output and weakening export demand. Manufacturers maintained high operating rates, resulting in comfortable supply levels across domestic and export markets. However, reduced overseas inquiries limited export absorption, increasing regional availability. Domestic pharmaceutical demand remained steady but insufficient to offset surplus material. Buyers exercised caution, engaging in selective purchasing and deferring bulk procurement.
Q3 2025:
Asia Pacific prices declined as major formulation centers in China and India moderated intake to align with steady but cautious production targets. Chinese producers adapted operating rates to variable feedstock conditions, while Indian transport networks faced seasonal routing shifts that influenced delivery timing. Import-reliant countries navigated container realignments in trans-shipment hubs, prompting diversified sourcing choices. Seasonal disruptions in Southeast Asian road networks also shaped procurement planning.
Q2 2025:
In the Asia Pacific region, paracetamol prices were driven by shifts in upstream raw material costs, particularly for para-aminophenol, and strong regional demand from formulation and export units. In China and India, environmental inspections and plant maintenance cycles affected API output. Meanwhile, pharmaceutical consumption trends in Southeast Asia and fluctuations in chemical input availability influenced intra-regional trade flows and procurement volumes for contract manufacturers.
This paracetamol price analysis can be expanded to include a comprehensive list of countries within the region.
| Region | Countries Covered |
|---|---|
| Asia Pacific | China, India, Indonesia, Pakistan, Bangladesh, Japan, Philippines, Vietnam, Thailand, South Korea, Malaysia, Nepal, Taiwan, Sri Lanka, Hongkong, Singapore, Australia, and New Zealand, among other Asian countries. |
Latin America Paracetamol Price Trend
Q1 2026:
The market for paracetamol in Latin America is primarily driven by the region's abundant natural resources, especially in nations like Chile and Brazil. However, paracetamol prices might fluctuate significantly due to political unpredictability and uneven regulatory frameworks.
Q4 2025:
Latin America's paracetamol market is predominantly influenced by its rich natural reserves, particularly in countries like Chile and Brazil. However, political instability and inconsistent regulatory frameworks can lead to significant volatility in paracetamol prices.
Q3 2025:
Infrastructure challenges and logistical inefficiencies often impact the supply chain, affecting Latin America’s ability to meet international demand consistently. Moreover, the paracetamol price index, economic fluctuations, and currency devaluation are critical factors that need to be considered when analyzing paracetamol pricing trends in this region.
This comprehensive review can be extended to include specific countries within the region.
| Region | Countries Covered |
|---|---|
| Latin America | Brazil, Mexico, Argentina, Columbia, Chile, Ecuador, and Peru, among other Latin American countries. |
Paracetamol Pricing Report, Market Analysis, and News
IMARC's latest publication, “Paracetamol Prices, Trend, Chart, Demand, Market Analysis, News, Historical and Forecast Data Report 2026 Edition,” presents a detailed examination of the paracetamol market, providing insights into both global and regional trends that are shaping prices. This report delves into the spot price of paracetamol at major ports and analyzes the composition of prices, including FOB and CIF terms. It also presents detailed paracetamol prices trend analysis by region, covering North America, Europe, Asia Pacific, Latin America, and Middle East and Africa. The factors affecting paracetamol pricing, such as the dynamics of supply and demand, geopolitical influences, and sector specific developments, are thoroughly explored. This comprehensive report helps stakeholders stay informed with the latest market news, regulatory updates, and technological progress, facilitating informed strategic decision-making and forecasting.

Paracetamol Industry Analysis
The global paracetamol industry size reached USD 809.97 Million in 2025. By 2034, IMARC Group expects the market to reach USD 1,141.00 Million, at a projected CAGR of 3.88% during 2026-2034. Growth is supported by consistent pharmaceutical consumption, the rising preference for analgesics, continuous formulation activities across developing and developed markets, and stable supply chain structures that align with the observed directional pricing movements across recent quarters.
Latest News and Developments:
- January 2025: India’s Council of Scientific & Industrial Research (CSIR) announced that it successfully developed and commercialized a fully indigenous process for manufacturing paracetamol, addressing the nation’s long-standing dependence on imported raw materials. The new technology allows domestic producers to scale up paracetamol output using locally sourced intermediates, thereby strengthening supply-chain security and supporting India’s pharmaceutical self-reliance initiatives.
Product Description
Paracetamol, also known as acetaminophen, is an analgesic and antipyretic compound widely used to reduce pain and fever. Its chemical composition is based on N acetyl para aminophenol, with the molecular formula C8H9NO2. It is commonly supplied as a white crystalline powder with good stability under recommended storage conditions. Paracetamol is used in tablets, capsules, syrups, suspensions, and combination medicines. It is widely applied in the pharmaceutical industry for treating headaches, muscle pain, dental pain, cold related fever, and general discomfort. The product is valued for its broad acceptance, predictable performance, and compatibility with many dosage forms.
Report Coverage
| Key Attributes | Details |
|---|---|
| Product Name | Paracetamol |
| Report Features | Exploration of Historical Trends and Market Outlook, Industry Demand, Industry Supply, Gap Analysis, Challenges, Paracetamol Price Analysis, and Segment-Wise Assessment. |
| Currency/Units | US$ (Data can also be provided in local currency) or Metric Tons |
| Region/Countries Covered | The current coverage includes analysis at the global and regional levels only. Based on your requirements, we can also customize the report and provide specific information for the following countries: Asia Pacific: China, India, Indonesia, Pakistan, Bangladesh, Japan, Philippines, Vietnam, Thailand, South Korea, Malaysia, Nepal, Taiwan, Sri Lanka, Hongkong, Singapore, Australia, and New Zealand Europe: Germany, France, United Kingdom, Italy, Spain, Russia, Turkey, Netherlands, Poland, Sweden, Belgium, Austria, Ireland, Switzerland, Norway, Denmark, Romania, Finland, Czech Republic, Portugal and Greece North America: United States and Canada Latin America: Brazil, Mexico, Argentina, Columbia, Chile, Ecuador, and Peru Middle East & Africa: Saudi Arabia, UAE, Israel, Iran, South Africa, Nigeria, Oman, Kuwait, Qatar, Iraq, Egypt, Algeria, and Morocco The list of countries presented is not exhaustive. Information on additional countries can be provided if required by the client. |
| Information Covered for Key Suppliers |
|
| Customization Scope | The report can be customized as per the requirements of the customer |
| Report Price and Purchase Option |
Plan A: Monthly Updates - Annual Subscription
Plan B: Quarterly Updates - Annual Subscription
Plan C: Biannually Updates - Annual Subscription
|
| Post-Sale Analyst Support | 360-degree analyst support after report delivery |
| Delivery Format | PDF and Excel through email (We can also provide the editable version of the report in PPT/Word format on special request) |
Key Benefits for Stakeholders:
- IMARC’s report presents a detailed analysis of paracetamol pricing, covering global and regional trends, spot prices at key ports, and a breakdown of FOB and CIF prices.
- The study examines factors affecting paracetamol price trend, including input costs, supply-demand shifts, and geopolitical impacts, offering insights for informed decision-making.
- The competitive landscape review equips stakeholders with crucial insights into the latest market news, regulatory changes, and technological advancements, ensuring a well-rounded, strategic overview for forecasting and planning.
- IMARC offers various subscription options, including monthly, quarterly, and biannual updates, allowing clients to stay informed with the latest market trends, ongoing developments, and comprehensive market insights. The paracetamol price charts ensure our clients remain at the forefront of the industry.
Need more help?
- Speak to our experienced analysts for insights on the current market scenarios.
- Include additional segments and countries to customize the report as per your requirement.
- Gain an unparalleled competitive advantage in your domain by understanding how to utilize the report and positively impacting your operations and revenue.
- For further assistance, please connect with our analysts.
 Request Customization
 Inquire Before Buying
 Speak to an Analyst
 Request Brochure
Benefits of Customization
- Personalize this research
- Triangulate with your data
- Get data as per your format and definition
- Gain a deeper dive into a specific application, geography, customer, or competitor
- Any level of personalization
Get in Touch With Us
UNITED STATES
Phone: +1-201-971-6302
INDIA
Phone: +91-120-433-0800
UNITED KINGDOM
Phone: +44-753-714-6104
Email: [email protected]
Client Testimonials


.webp)


Why Choose Us
IMARC offers trustworthy, data-centric insights into commodity pricing and evolving market trends, enabling businesses to make well-informed decisions in areas such as procurement, strategic planning, and investments. With in-depth knowledge spanning more than 1000 commodities and a vast global presence in over 150 countries, we provide tailored, actionable intelligence designed to meet the specific needs of diverse industries and markets.
1000
+Commodities
150
+Countries Covered
3000
+Clients
20
+Industry
Robust Methodologies & Extensive Resources
IMARC delivers precise commodity pricing insights using proven methodologies and a wealth of data to support strategic decision-making.
Subscription-Based Databases
Our extensive databases provide detailed commodity pricing, import-export trade statistics, and shipment-level tracking for comprehensive market analysis.
Primary Research-Driven Insights
Through direct supplier surveys and expert interviews, we gather real-time market data to enhance pricing accuracy and trend forecasting.
Extensive Secondary Research
We analyze industry reports, trade publications, and market studies to offer tailored intelligence and actionable commodity market insights.
Trusted by 3000+ industry leaders worldwide to drive data-backed decisions. From global manufacturers to government agencies, our clients rely on us for accurate pricing, deep market intelligence, and forward-looking insights.