
Europe Computational Fluid Dynamics Market Size, Share, Trends and Forecast by Deployment Mode, End User, and Country, 2025-2033
Europe Computational Fluid Dynamics Market Overview:
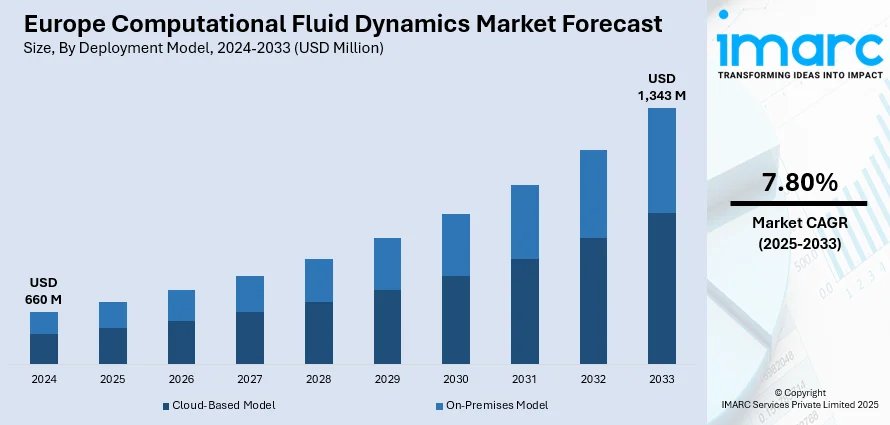
The Europe computational fluid dynamics market size reached USD 660 Million in 2024. Looking forward, IMARC Group expects the market to reach USD 1,343 Million by 2033, exhibiting a growth rate (CAGR) of 7.80% during 2025-2033.The market is propelled by the need for more sophisticated simulation tools in industries like automotive, aerospace, and energy, which seek to enhance product designs and increase performance. Increased use of cloud computing and AI technologies also fuels the demand for computational fluid dynamics (CFD) solutions, offering scalable and efficient software for intricate simulations. Also, the increasing emphasis on sustainability and energy efficiency, as well as the demand for affordable, time-saving options are major factors augmenting the Europe computational fluid dynamics market share.
|
Report Attribute
|
Key Statistics
|
|---|---|
|
Base Year
|
2024
|
|
Forecast Years
|
2025-2033
|
|
Historical Years
|
2019-2024
|
|
Market Size in 2024
|
USD 660 Million |
|
Market Forecast in 2033
|
USD 1,343 Million |
| Market Growth Rate 2025-2033 | 7.80% |
The market is majorly driven by the growing need for simulation-based analysis in different industries, especially automotive, aerospace, and energy. The automotive industry is utilizing CFD to improve vehicle performance, fuel efficiency, and aerodynamics, which is largely responsible for propelling market growth. Industry reports indicate that the FLAP-D market, including Frankfurt, London, Amsterdam, Paris, and Dublin, represents over 20% of Europe's total data centers. As data centers expand, the need for advanced cooling solutions grows, driving the adoption of computational fluid dynamics (CFD) technology. Moreover, the rapid evolution in high-performance computing (HPC) technology is accelerating the ability of CFD tools to do more complex simulations at increased rates.
To get more information on this market, Request Sample
In addition to this, the necessity for cost-effective design solutions for manufacturing is compelling industries to adopt CFD to simplify the development process. As per industry reports, more ambitious goals have been set in Europe, aiming for a 55% or greater reduction in emissions compared to 1990 levels by 2030, with a goal of achieving climate neutrality by 2050. Such targets are pushing large-scale changes across sectors, making sustainability in the environment a foremost priority. In this context, computational fluid dynamics (CFD) has a significant role to play in assisting industries in minimizing emissions and maximizing energy efficiency in different processes. Besides, policies and regulations set by governments with the aim of improving fuel efficiency are creating demand for CFD solutions. Apart from this, the increased interest in digital twins and virtual prototyping is additionally driving market growth by allowing firms to simulate and test virtually before actual production.
Europe Computational Fluid Dynamics Market Trends:
Well-Developed Aerospace, Military, and Aeronautical Sectors
Europe has a robust and well-established aerospace and defense industry, which makes it a significant contributor to the demand for computational fluid dynamics (CFD) software. According to the Aerospace, Security, and Defence Industries Association of Europe (ASD) 2024 report, turnover in the aerospace and defense sectors rose by 10.1% to EUR 290.4 Billion (about USD 331.056 Billion) in 2024, fueled by a 17% rise in defense and a 3% increase in civil aeronautics. These sectors are dependent highly on CFD for the airframe and propulsion system design as well as aerodynamics optimization. The defense industry also makes use of CFD technology to enhance the performance of military planes, missiles, and other sophisticated systems. The growing requirement for high-performance, fuel-saving, and stealth technology in both civilian and military aircraft has also fueled the uptake of CFD. Additionally, the desire for space exploration and satellite technology in Europe has resulted in increased investments in CFD for thermal analysis, structural integrity, and aerodynamics.
Extensive Use of the Software in the Automobile Sector
The expansion of the automotive industry is another key factor driving the Europe computational fluid dynamics market growth. With the need for fuel-efficient, low-emission, and aerodynamically better vehicles growing, automotive companies increasingly depend on CFD software to improve vehicle performance. A recent survey of automotive and manufacturing executives found that over 40% are investing up to EUR 5 Million (about USD 5.7 Million) in generative AI research and development (R&D) to enhance software development, while more than 10% are investing over EUR 20 Million (about USD 22.8 Million). CFD is employed by European car manufacturers for vehicle aerodynamics, thermal management, and EV development simulations. By modeling airflow around cars, companies can design cars to minimize drag and maximize fuel efficiency. Increasing emphasis on electric drive and autonomous vehicle systems has also accelerated the application of CFD for simulating and optimizing battery cooling systems, electric motor efficiency, and aerodynamics of electric vehicles. Also, the combination of CFD with other engineering software, including Finite Element Analysis (FEA), has increased the capability of performing multi-disciplinary simulations in vehicle design.
Growing Focus on Renewable Energy Infrastructure
The growing commitment to renewable energy sources and the adoption of CFD in energy infrastructure projects are positively impacting the Europe computational fluid dynamics market outlook. According to the European Investment Bank, EU countries invested nearly EUR 110 Billion (about USD 125.4 Billion) in renewable energy generation in 2023. Furthermore, European wind turbine companies such as Siemens Gamesa and Vestas also employ CFD for design and performance optimization of the turbine blades to extract the maximum amount of energy and become efficient. CFD is also essential in wind pattern studies, which aids in the siting of wind farms where there are ideal wind conditions. In solar energy, CFD is applied to model heat transfer and maximize the thermal efficiency of solar panels. Additionally, CFD application in hydrogen fuel systems, energy storage technologies, and geothermal projects has accelerated as Europe accelerates towards carbon neutrality. As per the Europe computational fluid dynamics market trends, the growing integration of these renewable systems necessitates high-level simulations for enhanced performance and energy efficiency, further increasing the demand for CFD solutions.
Europe Computational Fluid Dynamics Industry Segmentation:
IMARC Group provides an analysis of the key trends in each segment of the Europe computational fluid dynamics market, along with forecasts at the regional and country levels from 2025-2033. The market has been categorized based on deployment model and end user.
Breakup by Deployment Model:
- Cloud-Based Model
- On-Premises Model
Cloud based model leads the market with around 58.8% of market share in 2024. This segment is widely preferred as it is scalable, flexible, and cost-effective. With cloud infrastructure, organizations are able to utilize high-performance computational resources without making expensive initial hardware investments or having large IT infrastructure to maintain. The model enables businesses to rapidly scale operations in accordance with project requirements, enhancing the speed and efficiency of simulations. Also, the cloud facilitates real-time collaboration between teams in different locations, leading to increased productivity and innovation. With the CFD market expanding in Europe, the adoption of cloud-based solutions is likely to rise due to the increasing requirement for high-performance computing and sophisticated simulations across industries like aerospace, automotive, and energy. Cloud-based CFD software also facilitates quicker iteration cycles, providing organizations with a competitive advantage in product development and design optimization.
Analysis by End User:
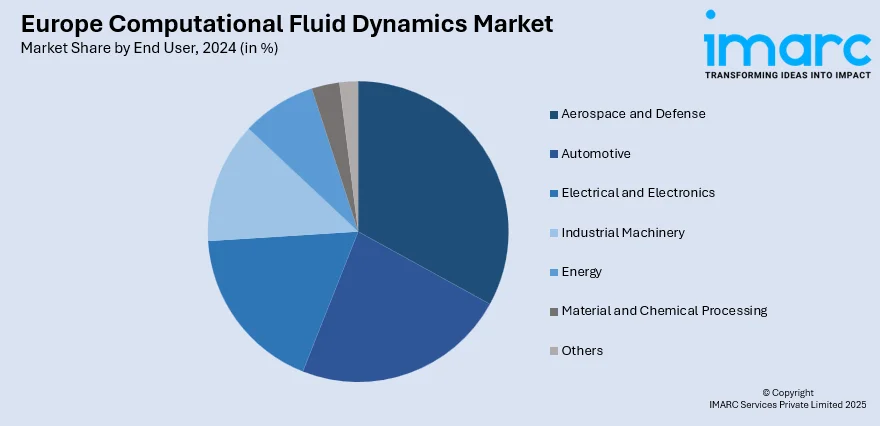
- Automotive
- Aerospace and Defense
- Electrical and Electronics
- Industrial Machinery
- Energy
- Material and Chemical Processing
- Others
Aerospace and defense lead the market with around 34.7% of market share in 2024. CFD technology is pivotal in refining the design and performance of aircraft, spacecraft, and defense equipment, enabling firms to execute intricate simulation work that would be expensive or problematic to accomplish in real-world testing. It helps to increase aerodynamic performance, decrease fuel burn, provide improved safety, and facilitate regulatory compliance. As more demand for sophisticated, efficient, and green aerospace innovations has been on the rise, CFD has become an invaluable tool in developing next-generation technologies like unmanned aerial vehicles (UAVs), hypersonic flight, and advanced propulsion systems. Increased dependence on CFD by the aerospace and defense sector is fueling the adoption of high-performance computing facilities, and thus, it is a pivotal sector in defining the trajectory of future CFD developments in Europe.
Analysis by Country:
- Germany
- France
- United Kingdom
- Italy
- Spain
- Others
In 2024, Germany accounted for the largest market share of over 28.9% due to its robust engineering and manufacturing industries. Being a powerhouse in sectors like automotive, aerospace, and energy, the country greatly depends on CFD for product development, optimization, and simulation. The government's focus on innovation, coupled with its well-developed research and development base, makes it a principal driver in the use and development of CFD technologies. German businesses employ CFD to increase aerodynamic efficiency, decrease power consumption, and ensure the safety and efficiency of their products. Furthermore, the country's shift towards Industry 4.0 and its emphasis on digitalization and automatization also fuels the need for sophisticated CFD solutions. Germany's strong manufacturing foundation and emphasis on eco-friendly technologies make the country a key driver in driving the growth of the market.
Competitive Landscape:
The market is characterized by intense competition, with a combination of new entrants and established players. Businesses are concentrating on innovation and differentiation, providing cutting-edge simulation software, cloud-enabled solutions, and artificial intelligence (AI) driven capabilities. Along with this, strategic collaborations, mergers, and acquisitions are prevalent as companies target improving their market positions. Businesses are also putting emphasis on offering easy-to-use interfaces and customization to meet different industrial requirements. In addition, research and development (R&D) spending is crucial in establishing advanced technologies that respond to the changing demands of industries like automotive, aerospace, and energy. Moreover, the combination of CFD with digital twins and real-time data analysis is becoming popular. According to the Europe computational fluid dynamics market forecast, the demand for CFD solutions is anticipated to increase greatly, fueled by growing adoption across industries in efforts to optimize efficiency and accelerate time-to-market. Additionally, growth in cloud computing and artificial intelligence (AI) reinforces market momentum further, resulting in increased competition and innovation.
The report provides a comprehensive analysis of the competitive landscape in the Europe computational fluid dynamics market with detailed profiles of all major companies.
Latest News and Developments:
- April 2025: Emmi AI, a Linz-based deep tech start-up, secured EUR 15 Million (about 17 Million) in seed funding to help it develop AI-powered simulation technology to address complex engineering challenges, such as computational fluid dynamics, thermal analysis, and material stress testing. Their platform replaces traditional numerical solvers with deep learning models capable of processing massive simulations in milliseconds, eliminating the need for labor-intensive manual set-up.
- March 2025: Volvo Cars, Ansys, and NVIDIA accelerated CFD simulations for the EX90 electric vehicle by 2.5x using Ansys Fluent and eight NVIDIA Blackwell GPUs. This breakthrough reduced simulation time from 24 to 6.5 hours, enabling faster design iterations, improved EV efficiency, and quicker time-to-market for optimized aerodynamics.
- October 2024: Altair and the Technical University of Munich achieved a breakthrough in quantum computing for CFD. Their new quantum algorithm enables 3D Lattice-Boltzmann simulations, marking a key step toward applying quantum computing to real-world fluid dynamics challenges with faster, scalable, and more complex simulations.
- June 2024: Neural Concept partnered with Siemens to integrate Simcenter STAR-CCM+ into its 3D deep learning platform. The collaboration enables OEMs to run large-scale CFD simulations via cloud-based HPC, accelerating AI-driven design, predictive modeling, and product development across industries like aerospace, automotive, and motorsports.
- June 2024: Berlin-based Dive Engineering Software raised USD 10 Million in Series A funding led by the D. E. Shaw Group. The funding supports expansion of its cloud-native, SPH-based CFD simulation platform, targeting complex industrial applications.
Europe Computational Fluid Dynamics Market Report Scope:
| Report Features | Details |
|---|---|
| Base Year of the Analysis | 2024 |
| Historical Period | 2019-2024 |
| Forecast Period | 2025-2033 |
| Units | Million USD |
| Scope of the Report |
Exploration of Historical Trends and Market Outlook, Industry Catalysts and Challenges, Segment-Wise Historical and Future Market Assessment:
|
| Deployment Models Covered | Cloud-Based Model, On-Premises Model |
| End Users Covered | Automotive, Aerospace and Defense, Electrical and Electronics, Industrial Machinery, Energy, Material and Chemical Processing, Others |
| Countries Covered | Germany, France, United Kingdom, Italy, Spain, Others |
| Customization Scope | 10% Free Customization |
| Post-Sale Analyst Support | 10-12 Weeks |
| Delivery Format | PDF and Excel through Email (We can also provide the editable version of the report in PPT/Word format on special request) |
Key Benefits for Stakeholders
- IMARC’s report offers a comprehensive quantitative analysis of various market segments, historical and current market trends, market forecasts, and dynamics of the Europe computational fluid dynamics market from 2019-2033.
- The Europe computational fluid dynamics market research report provides the latest information on the market drivers, challenges, and opportunities in the regional market.
- The study maps the leading, as well as the fastest-growing, regional markets.
- Porter's five forces analysis assist stakeholders in assessing the impact of new entrants, competitive rivalry, supplier power, buyer power, and the threat of substitution. It helps stakeholders to analyze the level of competition within the Europe computational fluid dynamics industry and its attractiveness.
- Competitive landscape allows stakeholders to understand their competitive environment and provides an insight into the current positions of key players in the market.
Key Questions Answered in This Report
The computational fluid dynamics market in Europe was valued at USD 660 Million in 2024.
The growth of the Europe computational fluid dynamics market is driven by increasing demand for advanced simulation tools in industries like automotive, aerospace, and energy, advancements in cloud-based technologies, the need for optimized product designs, and the rise of artificial intelligence and machine learning to enhance computational capabilities and efficiency.
The computational fluid dynamics market in Europe is projected to exhibit a CAGR of 7.80% during 2025-2033, reaching a value of USD 1,343 Million by 2033.
Cloud based model accounts for the largest share of the Europe computational fluid dynamics market deployment model. This segment's dominance is driven by the flexibility, scalability, and cost-efficiency cloud solutions offer, enabling businesses to access high-performance computing resources without heavy investments in on-premise infrastructure, and supporting real-time collaboration and faster simulation times.
Need more help?
- Speak to our experienced analysts for insights on the current market scenarios.
- Include additional segments and countries to customize the report as per your requirement.
- Gain an unparalleled competitive advantage in your domain by understanding how to utilize the report and positively impacting your operations and revenue.
- For further assistance, please connect with our analysts.
 Request Customization
 Speak to an Analyst
 Request Brochure
 Inquire Before Buying
Benefits of Customization
- Personalize this research
- Triangulate with your data
- Get data as per your format and definition
- Gain a deeper dive into a specific application, geography, customer, or competitor
- Any level of personalization
Get in Touch With Us
UNITED STATES
Phone: +1-201-971-6302
INDIA
Phone: +91-120-433-0800
UNITED KINGDOM
Phone: +44-753-714-6104
Email: sales@imarcgroup.com
Client Testimonials


.webp)


