
Europe 3D Mapping and Modeling Market Size, Share, Trends and Forecast by Component, Application, End-Use Industry, and Country, 2025-2033
Europe 3D Mapping and Modeling Market Overview:
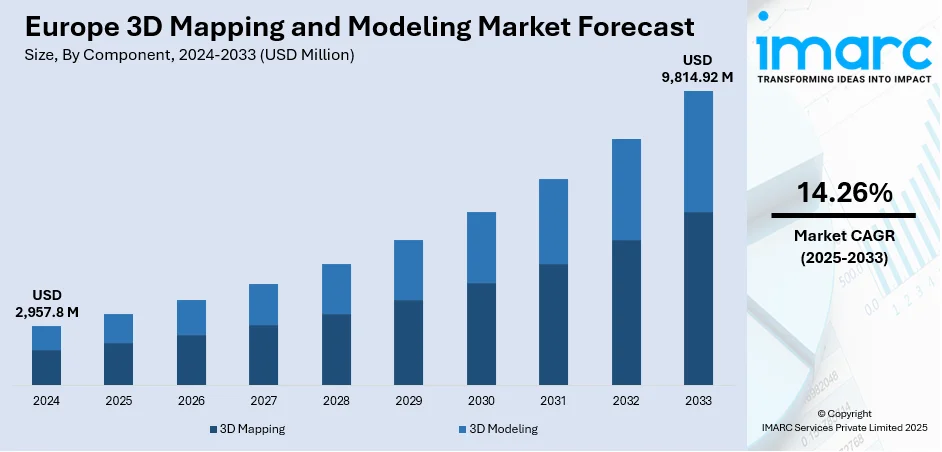
The Europe 3D mapping and modeling market size was valued at USD 2,957.8 Million in 2024. Looking forward, IMARC Group estimates the market to reach USD 9,814.92 Million by 2033, exhibiting a CAGR of 14.26% from 2025-2033. The quick evolution in 3D mapping technologies, especially photogrammetry and aerial mapping using drones, is propelling the market growth. Moreover, the growth of smart city programs is offering a favorable market outlook. Furthermore, the increasing need for autonomous vehicles (AVs) and advancements in aerospace is expanding the Europe 3D mapping and modeling market share.
|
Report Attribute
|
Key Statistics
|
|---|---|
|
Base Year
|
2024
|
|
Forecast Years
|
2025-2033
|
|
Historical Years
|
2019-2024
|
|
Market Size in 2024
|
USD 2,957.8 Million |
|
Market Forecast in 2033
|
USD 9,814.92 Million |
| Market Growth Rate 2025-2033 | 14.26% |
The European market is experiencing rapid growth as technology is improving and the demand from multiple industries is increasing. The adoption of 3D mapping technology for construction and geographic information systems GIS is growing as organizations are moving towards accurate and detailed real time information. Improvements in technologies like light detection and ranging (LiDAR), photogrammetry, and aerial mapping using drones are propelling the market growth, enabling firms to produce high quality precise 3D models of landscapes, buildings and infrastructure. Efficient and cost-effective project delivery is being facilitated through these technologies.
To get more information on this market, Request Sample
The rise in the construction of smart cities in European countries, along with the use of digital twins, is offering a favorable market outlook. Governing agencies and municipalities are investing substantial amounts of funds into urban development projects that need 3D mapping technologies to plan and manage operations. This shift is facilitating the development of digital twin technology, with real time 3D models of the project created for better decision making, monitoring, and optimization. Companies are also using these models to simulate real-life scenarios and predict the outcomes for urban planning and infrastructure management.
Europe 3D Mapping and Modeling Market Trends:
Technological Developments in Mapping Technology
The quick evolution in 3D mapping technologies, especially LiDAR, photogrammetry, and aerial mapping using drones, is propelling the Europe 3D mapping and modeling market growth. LiDAR technology, which employs laser light to compute distances, is gaining widespread acceptance because it can collect highly precise and detailed topographic data even under adverse conditions like heavy foliage or low lighting. Photogrammetry, a process of developing 3D models from photos, is also finding increasing acceptance as an economical solution for several different applications, such as architecture and land surveying. Increasing applications involving unmanned aerial vehicles (UAVs) or drones are also adding to the market growth by facilitating the recording of data from areas that were previously inaccessible or dangerous. These technologies are enhancing the accuracy, speed, and cost-effectiveness of 3D mapping, rendering it a business-critical capability in fields such as construction, city planning, and environment monitoring. In 2025, Europe is set to deploy a satellite to create a 3D map of the planet's forests, aimed at detecting illegal logging and monitoring climate change by assessing carbon storage in forests. The satellite named Biomass will be equipped with a unique radar that has never been in space. The device, equipped with a 12-meter (39-foot) wide antenna, generates a low-frequency electromagnetic signal that can reach through the densest rainforest canopy.
Rising Adoption of Smart City Programs
The growth of smart city programs is offering a favorable Europe 3D mapping and modeling market outlook. Governments and municipalities are making large-scale investments in digital technology to improve urban life, optimize infrastructure management, and rationalize city planning. 3D mapping is a central part of these smart city programs, as it enables the development of richly detailed, dynamic digital models of urban space. Such models are applied to various applications, including traffic flow optimization, energy management, and real-time infrastructure monitoring. Additionally, 3D models allow municipalities to model and predict the impact of different urban planning scenarios, resulting in more efficient and sustainable growth. With more cities in Europe embracing smart city policies, the need for 3D mapping and modeling solutions will significantly increase. IMARC Group predicts that the Europe smart cities market is anticipated to show a growth rate (CAGR) of 13.3% during 2025-2033.
Growing Demand for Autonomous Autos and Aerospace Use
One of the major Europe 3D mapping and modeling market trends includes the increasing need for autonomous vehicles (AVs) and advancements in aerospace. Autonomous vehicles depend heavily on accurate 3D mapping to drive through intricate surroundings and recognize obstacles in real time. The vehicles need highly accurate and current 3D maps to guarantee safety and efficiency, which is driving the need for mapping technology that can aid in such applications. In addition, the aerospace sector is finding widespread application of 3D mapping for flight planning, airspace management, and infrastructure monitoring purposes. The capability to model and analyze wide tracts of terrain and infrastructure at high accuracy is needed to optimize routes of flights and ensure safety. With both the AV and aerospace industries innovating and arranging various expos further in Europe, the need for sophisticated 3D mapping technologies is increasing. For instance, the ADAS & Autonomous Vehicle Technology Expo 2026 is set to take place on June 23, 24, and 25, 2026, at Messe Stuttgart, Germany.
Europe 3D Mapping and Modeling Industry Segmentation:
IMARC Group provides an analysis of the key trends in each segment of the Europe 3D mapping and modeling market, along with forecasts at the regional and country levels from 2025-2033. The market has been categorized based on component, application, and end-use industry.
Analysis by Component:
- 3D Mapping
- 3D Modeling
3D mapping stands as the largest component in 2024. It is revolutionizing sectors by delivering precise, real-time, and interactive spatial information. It is improving the depiction of intricate settings, allowing experts to make informed choices based on adaptable and accurate models. This technology allows for the oversight of construction projects, with teams monitoring progress and spotting potential problems as they occur. It enhances urban planning by providing detailed visualizations of city environments, which assist in creating infrastructure with improved accuracy. In environmental protection, 3D mapping assists researchers in tracking alterations in ecosystems, enabling the identification of trends in land use and plant life throughout time. It is transforming sectors such as gaming and virtual reality, enabling users to encounter more immersive and lifelike settings.
Analysis by Application:
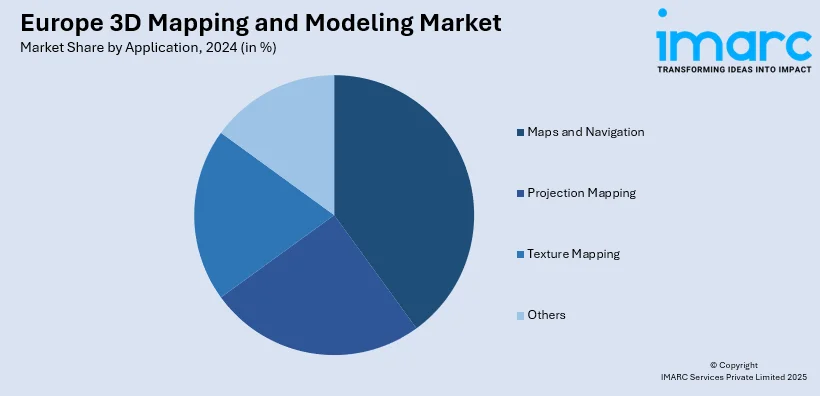
- Projection Mapping
- Texture Mapping
- Maps and Navigation
- Others
Maps and navigation lead the market in 2024. 3D modeling and mapping are revolutionizing navigation and maps by presenting more immersive and accurate portrayals of the world. Users are exploring cities with greater accuracy, as 3D models of cities and landscapes are presenting comprehensive, interactive visualizations. Navigation systems are adding 3D models to improve route planning, enabling drivers to know the environment they are in with better real-time information on road conditions, constructions, and hazards. Furthermore, 3D mapping is assisting pedestrians by navigating them through intricate settings such as malls, airports, and public transportation systems, enhancing wayfinding precision. Delivery companies are also assisted since 3D maps are streamlining route efficiency and decreasing delivery time by providing more precise insights into the geography. These developments in navigation are also continuously enhancing user experiences, making navigation more intuitive and dependable.
Analysis by End-Use Industry:
- Construction Industry
- Transportation Industry
- Automobile Industry
- Entertainment Industry
- Healthcare Industry
- Others
Construction industry leads the market in 2024 as it relies more on 3D mapping and modeling to boost planning, design, and project execution. The use of 3D models is allowing teams to view building designs in depth and ensure accuracy in structural planning, eliminating errors. Managers are tracking progress in real time by comparing as-built conditions to 3D models and finding discrepancies early on to avoid costly delays. Contractors are applying 3D mapping to perform site surveys, generating accurate topographical maps that are enhancing site analysis and land preparation. Furthermore, 3D modeling is helping in the coordination of different disciplines in construction, enabling architects, engineers, and contractors to work better together. All these advancements are making workflows more efficient, productivity better, and results of higher quality in construction projects.
Country Analysis:
- Germany
- France
- United Kingdom
- Italy
- Spain
- Others
In 2024, Germany accounted for the largest market share. The 3D mapping and modeling market in Germany is undergoing significant growth, driven by progressions in technology and increasing demand across various industries. Companies are adopting 3D mapping solutions to enhance urban planning, with municipal authorities using detailed models for better infrastructure management and city development. The construction sector is embracing 3D modeling for more precise planning and real-time monitoring of building projects, which is improving efficiency and reducing errors. Industries such as automotive and manufacturing are integrating 3D mapping to optimize product design, prototyping, and testing processes. Additionally, the German government is supporting innovation through initiatives aimed at advancing digitalization and smart city development, further propelling the market growth. The demand for more accurate geospatial data and the growing use of augmented reality (AR) and virtual reality (VR) technologies are also positively influencing the market.
Competitive Landscape:
Key players in the market are actively expanding their offerings by integrating cutting-edge technologies, such as machine learning (ML), artificial intelligence (AI), and augmented reality (AR). Companies are developing advanced software solutions to enhance the accuracy and efficiency of 3D models, targeting industries like construction, urban planning, and automotive. They are forming strategic partnerships with tech firms and government bodies to accelerate innovation and drive the adoption of smart city projects. Several companies are also focusing on expanding their product portfolios, offering tailored solutions that cater to specific market needs. As per the Europe 3D mapping and modeling market forecast, key players are expected to invest in research and development (R&D) to stay competitive and increase their presence through collaborations to enhance customer reach and service delivery.
The report provides a comprehensive analysis of the competitive landscape in the Europe 3D mapping and modeling market with detailed profiles of all major companies.
Latest News and Developments:
- July 2025: Apollo3D, based in Otley, completed 3D virtual scans of over 350 Primark stores across Europe to support LED lighting upgrades. The project cut survey time by over 80%, accelerated rollouts, and improved decision-making. The immersive models enabled remote access, aiding store reconfigurations and long-term facility planning across European retail sites.
- April 2025: ESA successfully launched the Biomass satellite aboard Vega-C from French Guiana to begin a five-year mission of 3D forest mapping. Using pioneering P-band radar, it enabled deep canopy scans and aimed to generate detailed global maps of forest structure and biomass, supporting carbon cycle assessments and environmental modeling.
- June 2024: Germany-based ColorDigital launched DMIx SamplR, a high-precision scanner for creating digital twins of flat materials using Apple iPhone technology. It allowed real-time 3D previews, remote texture development, and full integration with the DMIx platform, advancing material modeling for industries like fashion, architecture, and automotive with seamless collaboration and reduced sampling needs.
Europe 3D Mapping and Modeling Market Report Scope:
| Report Features | Details |
|---|---|
| Base Year of the Analysis | 2024 |
| Historical Period | 2019-2024 |
| Forecast Period | 2025-2033 |
| Units | Million USD |
| Scope of the Report |
Exploration of Historical Trends and Market Outlook, Industry Catalysts and Challenges, Segment-Wise Historical and Future Market Assessment:
|
| Components Covered | 3D Mapping, 3D Modeling |
| Applications Covered | Projection Mapping, Texture Mapping, Maps and Navigation, Others |
| End-Use Industries Covered | Construction Industry, Transportation Industry, Automobile Industry, Entertainment Industry, Healthcare Industry, Others |
| Countries Covered | Germany, France, United Kingdom, Italy, Spain, Others |
| Customization Scope | 10% Free Customization |
| Post-Sale Analyst Support | 10-12 Weeks |
| Delivery Format | PDF and Excel through Email (We can also provide the editable version of the report in PPT/Word format on special request) |
Key Benefits for Stakeholders:
- IMARC’s report offers a comprehensive quantitative analysis of various market segments, historical and current market trends, market forecasts, and dynamics of the Europe 3D mapping and modeling market from 2019-2033.
- The research study provides the latest information on the market drivers, challenges, and opportunities in the Europe 3D mapping and modeling market.
- Porter's Five Forces analysis assists stakeholders in assessing the impact of new entrants, competitive rivalry, supplier power, buyer power, and the threat of substitution. It helps stakeholders to analyze the level of competition within the 3D mapping and modeling industry and its attractiveness.
- Competitive landscape allows stakeholders to understand their competitive environment and provides an insight into the current positions of key players in the market.
Key Questions Answered in This Report
The 3D mapping and modeling market in Europe was valued at USD 2,957.8 Million in 2024.
The Europe 3D mapping and modeling market is projected to exhibit a CAGR of 14.26% during 2025-2033, reaching a value of USD 9,814.92 Million by 2033.
Key drivers include advancements in mapping technologies like LiDAR, photogrammetry, and drone usage, the growth of smart city programs, increasing demand for autonomous vehicles, and the expansion of aerospace applications, all promoting widespread adoption and innovation.
3D mapping remains the largest component as it transforms industries with precise, real-time, and interactive spatial data. Its ability to create detailed digital representations enhances decision-making, planning, and visualization across sectors like construction, transportation, and urban development, driving efficiency and enabling innovative solutions for complex real-world challenges.
Maps and navigation dominate the market as 3D mapping and modeling transform traditional mapping into immersive, highly accurate visual experiences. These technologies enhance route planning, real-time navigation, and spatial awareness, benefiting applications in transportation, tourism, and logistics while meeting growing demand for detailed, interactive representations of real-world environments.
The construction industry leads the market as it increasingly leverages 3D mapping and modeling to enhance planning, design accuracy, and project execution. These technologies enable better visualization, collaboration, and risk management, streamlining workflows and supporting complex infrastructure projects while aligning with the industry’s push for efficiency and innovation.
Germany leads the Europe 3D mapping and modeling market due to its strong focus on digital transformation, advanced infrastructure development, and innovation in automotive and manufacturing sectors. Supportive government initiatives, adoption of smart city solutions, and integration of cutting-edge technologies drive its dominance, fostering widespread application across industries.
Need more help?
- Speak to our experienced analysts for insights on the current market scenarios.
- Include additional segments and countries to customize the report as per your requirement.
- Gain an unparalleled competitive advantage in your domain by understanding how to utilize the report and positively impacting your operations and revenue.
- For further assistance, please connect with our analysts.
 Request Customization
 Speak to an Analyst
 Request Brochure
 Inquire Before Buying
Benefits of Customization
- Personalize this research
- Triangulate with your data
- Get data as per your format and definition
- Gain a deeper dive into a specific application, geography, customer, or competitor
- Any level of personalization
Get in Touch With Us
UNITED STATES
Phone: +1-201-971-6302
INDIA
Phone: +91-120-433-0800
UNITED KINGDOM
Phone: +44-753-714-6104
Email: sales@imarcgroup.com
Client Testimonials


.webp)


