
Energy Drink Manufacturing Plant Project Report 2026: Industry Trends, Plant Setup, Machinery, Raw Materials, Investment Opportunities, Cost and Revenue
Energy Drink Manufacturing Plant Project Report (DPR) Summary:
IMARC Group's comprehensive DPR report, titled "Energy Drink Manufacturing Plant Project Report 2026: Industry Trends, Plant Setup, Machinery, Raw Materials, Investment Opportunities, Cost and Revenue," provides a complete roadmap for setting up an energy drink manufacturing unit. The energy drink market is driven by the increasing consumer demand for functional beverages that boost energy levels, enhance mental alertness, and improve physical endurance. The global energy drink market size was valued at USD 50.81 Billion in 2025. According to IMARC Group estimates, the market is expected to reach USD 83.26 Billion by 2034, exhibiting a CAGR of 5.64% from 2026 to 2034.
This feasibility report covers a comprehensive market overview to micro-level information such as unit operations involved, raw material requirements, utility requirements, infrastructure requirements, machinery and technology requirements, manpower requirements, packaging requirements, transportation requirements, etc.
The energy drink manufacturing plant setup cost is provided in detail covering project economics, capital investments (CapEx), project funding, operating expenses (OpEx), income and expenditure projections, fixed costs vs. variable costs, direct and indirect costs, expected ROI and net present value (NPV), profit and loss account, financial analysis, etc.
.webp)
Access the Detailed Feasibility Analysis, Request Sample
What is Energy Drink?
Energy drinks are functional beverages that help increase the level of energy and concentration in people. They contain caffeine, sugar, vitamins, and other ingredients like taurine and guarana that help the consumer feel more energized and perform functions better. Energy drinks are available in different tastes and variants to suit the demand of different people. For instance, the major demographic that uses these drinks is athletes who are looking for energy drinks that will help them perform better. Since the content contains high caffeine and sugars, these energy drinks give people instant energy. In addition to this, the other ingredients, for example, vitamins B, help to renew the body’s nutrients.
Key Investment Highlights
- Process Used: Ingredient mixing, carbonating, flavor formulation, and packaging.
- End-use Industries: Sports & fitness, healthcare, retail, entertainment, and corporate sectors.
- Applications: Used for energy drink formulations, pre-workout supplements, recovery beverages, and ready-to-drink functional shots.
Energy Drink Plant Capacity:
The proposed manufacturing facility is designed with an annual production capacity ranging between 40–60 million liters, enabling economies of scale while maintaining operational flexibility.
Energy Drink Plant Profit Margins:
The project demonstrates healthy profitability potential under normal operating conditions. Gross profit margins typically range between 25-35%, supported by stable demand and value-added applications.
- Gross Profit: 25-35%
- Net Profit: 8-12%
Energy Drink Plant Cost Analysis:
The operating cost structure of an energy drink manufacturing plant is primarily driven by raw material consumption, particularly caffeine, which accounts for approximately 60-70% of total operating expenses (OpEx).
- Raw Materials: 60-70% of OpEx
- Utilities: 10-15% of OpEx
Financial Projection:
The financial projections for the proposed project have been developed based on realistic assumptions related to capital investment, operating costs, production capacity utilization, pricing trends, and demand outlook. These projections provide a comprehensive view of the project’s financial viability, ROI, profitability, and long-term sustainability.
Major Applications:
- Ingredient Processing: Handling and blending of caffeine, vitamins, sweeteners, and flavor compounds.
- Formulation & Mixing: Batch mixing systems, carbonation units, and homogenization processes.
- Filling & Packaging: Can and bottle filling lines, sealing equipment, and labeling systems.
- Quality Control & Distribution: Product testing, storage, and cold-chain or ambient distribution systems.
Why Energy Drink Manufacturing?
✓ Strong Consumer Demand & Lifestyle Alignment: Energy drinks have become a staple for athletes, professionals, students, and fitness-conscious consumers, driven by fast-paced lifestyles, extended working hours, and growing participation in sports and gaming—positioning them as a high-demand functional beverage category.
✓ Moderate but Defensible Entry Barriers: While capital requirements are lower than heavy industries, strict food safety regulations, formulation expertise, quality consistency, regulatory approvals, and brand trust create meaningful entry barriers that favor experienced manufacturers with strong compliance and quality systems.
✓ Megatrend Alignment: Rising health awareness, demand for functional beverages, on-the-go consumption, and premiumization trends are fueling sustained growth. Segments such as sugar-free, natural caffeine, and fortified energy drinks are experiencing strong double-digit growth in many markets.
✓ Policy & Regulatory Support: Government focus on food processing, beverage manufacturing, and domestic value addition—along with initiatives supporting MSMEs and food parks—indirectly supports energy drink manufacturing through improved infrastructure, subsidies, and streamlined compliance frameworks.
✓ Localization & Supply Chain Reliability: Beverage brands and distributors increasingly prefer local manufacturing to reduce logistics costs, ensure freshness, respond faster to market trends, and manage input price volatility—creating opportunities for regional producers with efficient sourcing and scalable operations.
Transforming Vision into Reality:
This report provides the comprehensive blueprint needed to transform your energy drink manufacturing vision into a technologically advanced and highly profitable reality.
Energy Drink Industry Outlook 2026:
The energy drink industry is experiencing significant growth, driven by the increasing demand for functional beverages across multiple consumer segments. As per the Ministry of Food Processing, India’s non-alcoholic beverages market was valued at USD 30,846.6 Million in 2023 and is projected to reach USD 64,248.9 Million by 2033 growing at a CAGR of 7.66% from 2024 to 2033. The surge in health-conscious consumers seeking energy-boosting products has led to the rise of innovative energy drink formulations that incorporate natural ingredients, low sugar, and added health benefits. The shift toward healthier and more natural alternatives is opening up new market opportunities. The Asia-Pacific region, led by markets like China and India, is expected to witness robust growth due to rising urbanization, an expanding middle class, and the growing trend of fitness and sports activities. North America and Europe will continue to show steady growth, fueled by a rise in energy drink consumption among professionals and students.
Leading Energy Drink Manufacturers:
Leading manufacturers in the global energy drink industry include several multinational companies with extensive production capacities and diverse application portfolios. Key players include:
- Red Bull GmbH
- PepsiCo (Mountain Dew and Rockstar)
- The Coca-Cola Company (Monster Energy)
- Monster Beverage Corporation
- Glanbia Performance Nutrition
all of which serve end-use sectors such as sports & fitness, healthcare, retail, entertainment, and corporate sectors.
How to Setup an Energy Drink Manufacturing Plant?
Setting up an energy drink manufacturing plant requires evaluating several key factors, including technological requirements and quality assurance.
Some of the critical considerations include:
- Detailed Process Flow: The manufacturing process is a multi-step operation that involves several unit operations, material handling, and quality checks. Below are the main stages involved in the energy drink manufacturing process flow:
- Unit Operations Involved
- Mass Balance and Raw Material Requirements
- Quality Assurance Criteria
- Technical Tests
-
Site Selection: The location must offer easy access to key raw materials such as water, caffeine, taurine, B vitamins, sweeteners, flavors, cans/bottles. Proximity to target markets will help minimize distribution costs. The site must have robust infrastructure, including reliable transportation, utilities, and waste management systems. Compliance with local zoning laws and environmental regulations must also be ensured.
-
Plant Layout Optimization: The layout should be optimized to enhance workflow efficiency, safety, and minimize material handling. Separate areas for raw material storage, production, quality control, and finished goods storage must be designated. Space for future expansion should be incorporated to accommodate business growth.
-
Equipment Selection: High-quality, corrosion-resistant machinery tailored for energy drink production must be selected. Essential equipment includes water purification systems, mixing and blending tanks, carbonation units, pasteurizers, filtration systems, filling machines, capping equipment, and packaging lines. All machinery must comply with industry standards for safety, efficiency, and reliability.
-
Raw Material Sourcing: Reliable suppliers must be secured for raw materials like water, caffeine, taurine, B vitamins, sweeteners, flavors, cans/bottles to ensure consistent production quality. Minimizing transportation costs by selecting nearby suppliers is essential. Sustainability and supply chain risks must be assessed, and long-term contracts should be negotiated to stabilize pricing and ensure a steady supply.
-
Safety and Environmental Compliance: Safety protocols must be implemented throughout the manufacturing process of energy drink. Advanced monitoring systems should be installed to detect leaks or deviations in the process. Effluent treatment systems are necessary to minimize environmental impact and ensure compliance with emission standards.
-
Quality Assurance Systems: A comprehensive quality control system should be established throughout production. Analytical instruments must be used to monitor product concentration, purity, and stability. Documentation for traceability and regulatory compliance must be maintained.
Project Economics:
Establishing and operating an energy drink manufacturing plant involves various cost components, including:
-
Capital Investment: The total capital investment depends on plant capacity, technology, and location. This investment covers land acquisition, site preparation, and necessary infrastructure.
-
Equipment Costs: Equipment costs, such as those for water purification systems, mixing and blending tanks, carbonation units, pasteurizers, filtration systems, filling machines, capping equipment, and packaging lines, represent a significant portion of capital expenditure. The scale of production and automation level will determine the total cost of machinery.
-
Raw Material Expenses: Raw materials, including water, caffeine, taurine, B vitamins, sweeteners, flavors, cans/bottles, are a major part of operating costs. Long-term contracts with reliable suppliers will help mitigate price volatility and ensure a consistent supply of materials.
-
Infrastructure and Utilities: Costs associated with land acquisition, construction, and utilities (electricity, water, steam) must be considered in the financial plan.
-
Operational Costs: Ongoing expenses for labor, maintenance, quality control, and environmental compliance must be accounted for. Optimizing processes and providing staff training can help control these operational costs.
-
Financial Planning: A detailed financial analysis, including income projections, expenditures, and break-even points, must be conducted. This analysis aids in securing funding and formulating a clear financial strategy.
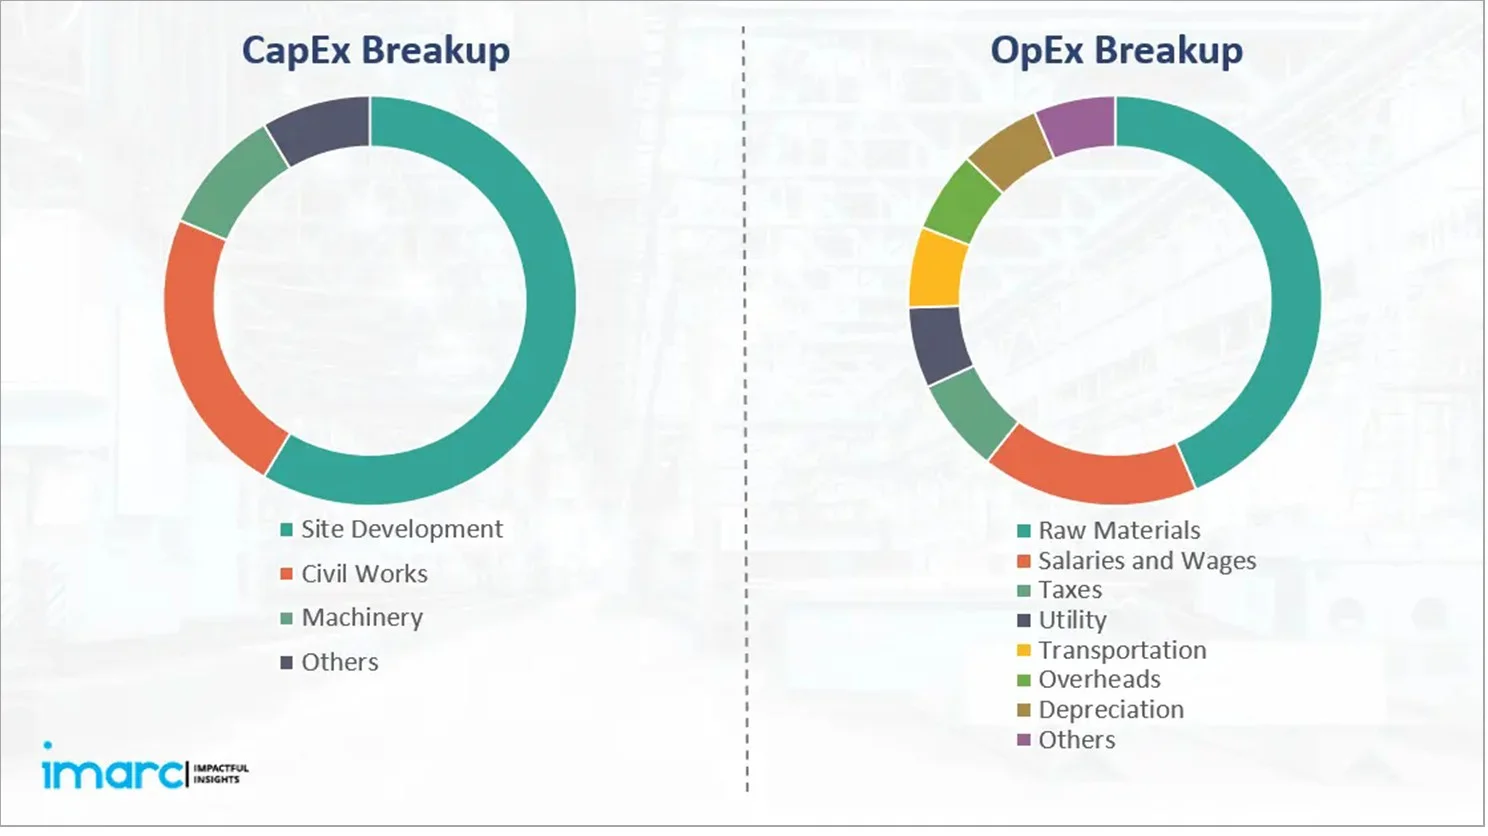
Capital Expenditure (CapEx) and Operational Expenditure (OpEx) Analysis:
Capital Investment (CapEx): Machinery costs account for the largest portion of the total capital expenditure. The cost of land and site development, including charges for land registration, boundary development, and other related expenses, forms a substantial part of the overall investment. This allocation ensures a solid foundation for safe and efficient plant operations.
Operating Expenditure (OpEx): In the first year of operations, the operating cost for the energy drink manufacturing plant is projected to be significant, covering raw materials, utilities, depreciation, taxes, packing, transportation, and repairs and maintenance. By the fifth year, the total operational cost is expected to increase substantially due to factors such as inflation, market fluctuations, and potential rises in the cost of key materials. Additional factors, including supply chain disruptions, rising consumer demand, and shifts in the global economy, are expected to contribute to this increase.
Capital Expenditure Breakdown:
| Particulars | Cost (in US$) |
|---|---|
| Land and Site Development Costs | XX |
| Civil Works Costs | XX |
| Machinery Costs | XX |
| Other Capital Costs | XX |
To access CapEx Details, Request Sample
Operational Expenditure Breakdown:
| Particulars | In % |
|---|---|
| Raw Material Cost | 60-70% |
| Utility Cost | 10-15% |
| Transportation Cost | XX |
| Packaging Cost | XX |
| Salaries and Wages | XX |
| Depreciation | XX |
| Taxes | XX |
| Other Expenses | XX |
To access OpEx Details, Request Sample
Profitability Analysis:
| Particulars | Unit | Year 1 | Year 2 | Year 3 | Year 4 | Year 5 | Average |
|---|---|---|---|---|---|---|---|
| Total Income | US$ | XX | XX | XX | XX | XX | XX |
| Total Expenditure | US$ | XX | XX | XX | XX | XX | XX |
| Gross Profit | US$ | XX | XX | XX | XX | XX | XX |
| Gross Margin | % | XX | XX | XX | XX | XX | 25-35% |
| Net Profit | US$ | XX | XX | XX | XX | XX | XX |
| Net Margin | % | XX | XX | XX | XX | XX | 8-12% |
To access Financial Analysis, Request Sample
Latest Industry Developments:
- May 2025: PepsiCo announced a groundbreaking worldwide partnership with Formula 1, as part of a multi-year commitment. This partnership unites the world's fastest growing sport with three of PepsiCo's powerhouse brands: Sting Energy, Gatorade, and Doritos.
- February 2025: UFC and Monster Energy announced a multiyear extension of their long-standing collaboration, whereby Monster will remain the UFC's exclusive worldwide Official Energy Drink.
Report Coverage:
| Report Features | Details |
|---|---|
| Product Name | Energy Drink |
| Report Coverage | Detailed Process Flow: Unit Operations Involved, Quality Assurance Criteria, Technical Tests, Mass Balance, and Raw Material Requirements Land, Location and Site Development: Selection Criteria and Significance, Location Analysis, Project Planning and Phasing of Development, Environmental Impact, Land Requirement and Costs Plant Layout: Importance and Essentials, Layout, Factors Influencing Layout Plant Machinery: Machinery Requirements, Machinery Costs, Machinery Suppliers (Provided on Request) Raw Materials: Raw Material Requirements, Raw Material Details and Procurement, Raw Material Costs, Raw Material Suppliers (Provided on Request) Packaging: Packaging Requirements, Packaging Material Details and Procurement, Packaging Costs, Packaging Material Suppliers (Provided on Request) Other Requirements and Costs: Transportation Requirements and Costs, Utility Requirements and Costs, Energy Requirements and Costs, Water Requirements and Costs, Human Resource Requirements and Costs Project Economics: Capital Costs, Techno-Economic Parameters, Income Projections, Expenditure Projections, Product Pricing and Margins, Taxation, Depreciation Financial Analysis: Liquidity Analysis, Profitability Analysis, Payback Period, Net Present Value, Internal Rate of Return, Profit and Loss Account, Uncertainty Analysis, Sensitivity Analysis, Economic Analysis Other Analysis Covered in The Report: Market Trends and Analysis, Market Segmentation, Market Breakup by Region, Price Trends, Competitive Landscape, Regulatory Landscape, Strategic Recommendations, Case Study of a Successful Venture |
| Currency | US$ (Data can also be provided in the local currency) |
| Customization Scope | The report can also be customized based on the requirement of the customer |
| Post-Sale Analyst Support | 10-12 Weeks |
| Delivery Format | PDF and Excel through email (We can also provide the editable version of the report in PPT/Word format on special request) |
Report Customization
While we have aimed to create an all-encompassing energy drink plant project report, we acknowledge that individual stakeholders may have unique demands. Thus, we offer customized report options that cater to your specific requirements. Our consultants are available to discuss your business requirements, and we can tailor the report's scope accordingly. Some of the common customizations that we are frequently requested to make by our clients include:
- The report can be customized based on the location (country/region) of your plant.
- The plant’s capacity can be customized based on your requirements.
- Plant machinery and costs can be customized based on your requirements.
- Any additions to the current scope can also be provided based on your requirements.
Why Buy IMARC Reports?
- The insights provided in our reports enable stakeholders to make informed business decisions by assessing the feasibility of a business venture.
- Our extensive network of consultants, raw material suppliers, machinery suppliers and subject matter experts spans over 100+ countries across North America, Europe, Asia Pacific, South America, Africa, and the Middle East.
- Our cost modeling team can assist you in understanding the most complex materials. With domain experts across numerous categories, we can assist you in determining how sensitive each component of the cost model is and how it can affect the final cost and prices.
- We keep a constant track of land costs, construction costs, utility costs, and labor costs across 100+ countries and update them regularly.
- Our client base consists of over 3000 organizations, including prominent corporations, governments, and institutions, who rely on us as their trusted business partners. Our clientele varies from small and start-up businesses to Fortune 500 companies.
- Our strong in-house team of engineers, statisticians, modeling experts, chartered accountants, architects, etc. has played a crucial role in constructing, expanding, and optimizing sustainable manufacturing plants worldwide.
Need more help?
- Speak to our experienced analysts for insights on the current market scenarios.
- Include additional segments and countries to customize the report as per your requirement.
- Gain an unparalleled competitive advantage in your domain by understanding how to utilize the report and positively impacting your operations and revenue.
- For further assistance, please connect with our analysts.


Factory Setup Services
IMARC Group's factory setup services streamline the entire establishment process, ensuring efficient planning, seamless execution, and optimal operational readiness for your manufacturing facility.


Site Selection Services
IMARC Group's site selection services optimize location choices for businesses, ensuring strategic, cost-effective, and efficient manufacturing operations.


Factory Audit Services
IMARC Group's plant audit services offer comprehensive evaluations of your industrial facility's health, efficiency, and regulatory compliance.


Regulatory Approvals, and Licensing Services
IMARC Group's regulatory approval and licensing services ensure businesses meet all compliance requirements, facilitating smooth and timely market entry.
 Inquire Before Buying
 Speak to an Analyst
 Request Brochure
 Request Customization
Frequently Asked Questions
Capital requirements generally include land acquisition, construction, equipment procurement, installation, pre-operative expenses, and initial working capital. The total amount varies with capacity, technology, and location.
To start an energy drink manufacturing business, one needs to conduct a market feasibility study, secure required licenses, arrange funding, select suitable land, procure equipment, recruit skilled labor, and establish a supply chain and distribution network.
Energy drink manufacturing requires raw materials such as caffeine, sweeteners, B vitamins, taurine, and water as the base. Additional ingredients include herbal extracts like guarana and ginseng, flavorings, colorants, acidity regulators (such as citric acid), preservatives, and packaging materials like cans or bottles.
An energy drink factory typically requires ingredient mixing machines, water purification systems, pasteurization equipment, filling machines, carbonation units, labeling machines, and packaging equipment. Additional equipment includes storage tanks and quality control testing tools.
The main steps generally include:
-
Sourcing and preparing raw ingredients
-
Mixing ingredients to desired formulation
-
Water purification and treatment
-
Pasteurization for sterilization
-
Carbonation of the drink
-
Filling bottles or cans with drink
-
Labeling and packaging for distribution
-
Quality control and testing
Usually, the timeline can range from 12 to 24 months to start an energy drink manufacturing plant, depending on factors like site development, machinery installation, environmental clearances, safety measures, and trial runs.
Challenges may include high capital requirements, securing regulatory approvals, ensuring raw material supply, competition, skilled manpower availability, and managing operational risks.
Typical requirements include business registration, environmental clearances, factory licenses, fire safety certifications, and industry-specific permits. Local/state/national regulations may apply depending on the location.
The top energy drink manufacturers are:
-
Red Bull GmbH
-
Monster Beverage Corporation
-
Coca-Cola Company
-
PepsiCo
-
Suntory Beverage & Food
Profitability depends on several factors including market demand, manufacturing efficiency, pricing strategy, raw material cost management, and operational scale. Profit margins usually improve with capacity expansion and increased capacity utilization rates.
Cost components typically include:
-
Land and Infrastructure
-
Machinery and Equipment
-
Building and Civil Construction
-
Utilities and Installation
-
Working Capital
Break even in an energy drink manufacturing business typically range from 3 to 6 years, depending on scale, regulatory compliance costs, raw material pricing, and market demand. Efficient manufacturing and export opportunities can help accelerate returns.
Governments may offer incentives such as capital subsidies, tax exemptions, reduced utility tariffs, export benefits, or interest subsidies to promote manufacturing under various national or regional industrial policies.
Financing can be arranged through term loans, government-backed schemes, private equity, venture capital, equipment leasing, or strategic partnerships. Financial viability assessments help identify optimal funding routes.