
E-Commerce Market Size, Share, Trends and Forecast by Type, Transaction, and Region 2026-2034
Global E-Commerce Market Size, Share, Trends & Forecast (2026-2034)
The global e-commerce market size was valued at USD 33.80 Trillion in 2025 and is projected to reach USD 243.40 Trillion by 2034, exhibiting a CAGR of 24.54% during the forecast period 2026-2034. Rapid mobile commerce adoption—surging B2B platform digitization, AI-powered personalization, and expanding cross-border trade frameworks are fuelling the e-commerce market growth. Business-to-Business (B2B) leads transaction at 46.7% in 2025, while Home Appliances dominates the type segment at 28.4%. Asia Pacific accounts for 54.3% of global revenue in 2025, the world's largest regional market.
Market Snapshot
|
Metric |
Value |
|
Market Size (2025) |
USD 33.80 Trillion |
|
Forecast Market Size (2034) |
USD 243.40 Trillion |
|
CAGR (2026-2034) |
24.54% |
|
Market Size (2030) |
USD 101.17 Trillion |
|
Base Year |
2025 |
|
Historical Period |
2020-2025 |
|
Forecast Period |
2026-2034 |
|
Largest Region |
Asia Pacific (54.3% share, 2025) |
|
Fastest Growing Region |
Asia Pacific (CAGR ~25.9%) |
|
Dominant Transaction |
Business-to-Business – B2B (46.7%, 2025) |
|
Leading Type |
Home Appliances (28.4%, 2025) |
The global e-commerce market growth trajectory from 2020 through 2034 reflects a consistent historical expansion driven by the COVID-19-accelerated shift to online retail, followed by a sustained high-growth forecast powered by B2B digitization, social commerce proliferation, and AI-driven consumer experiences.
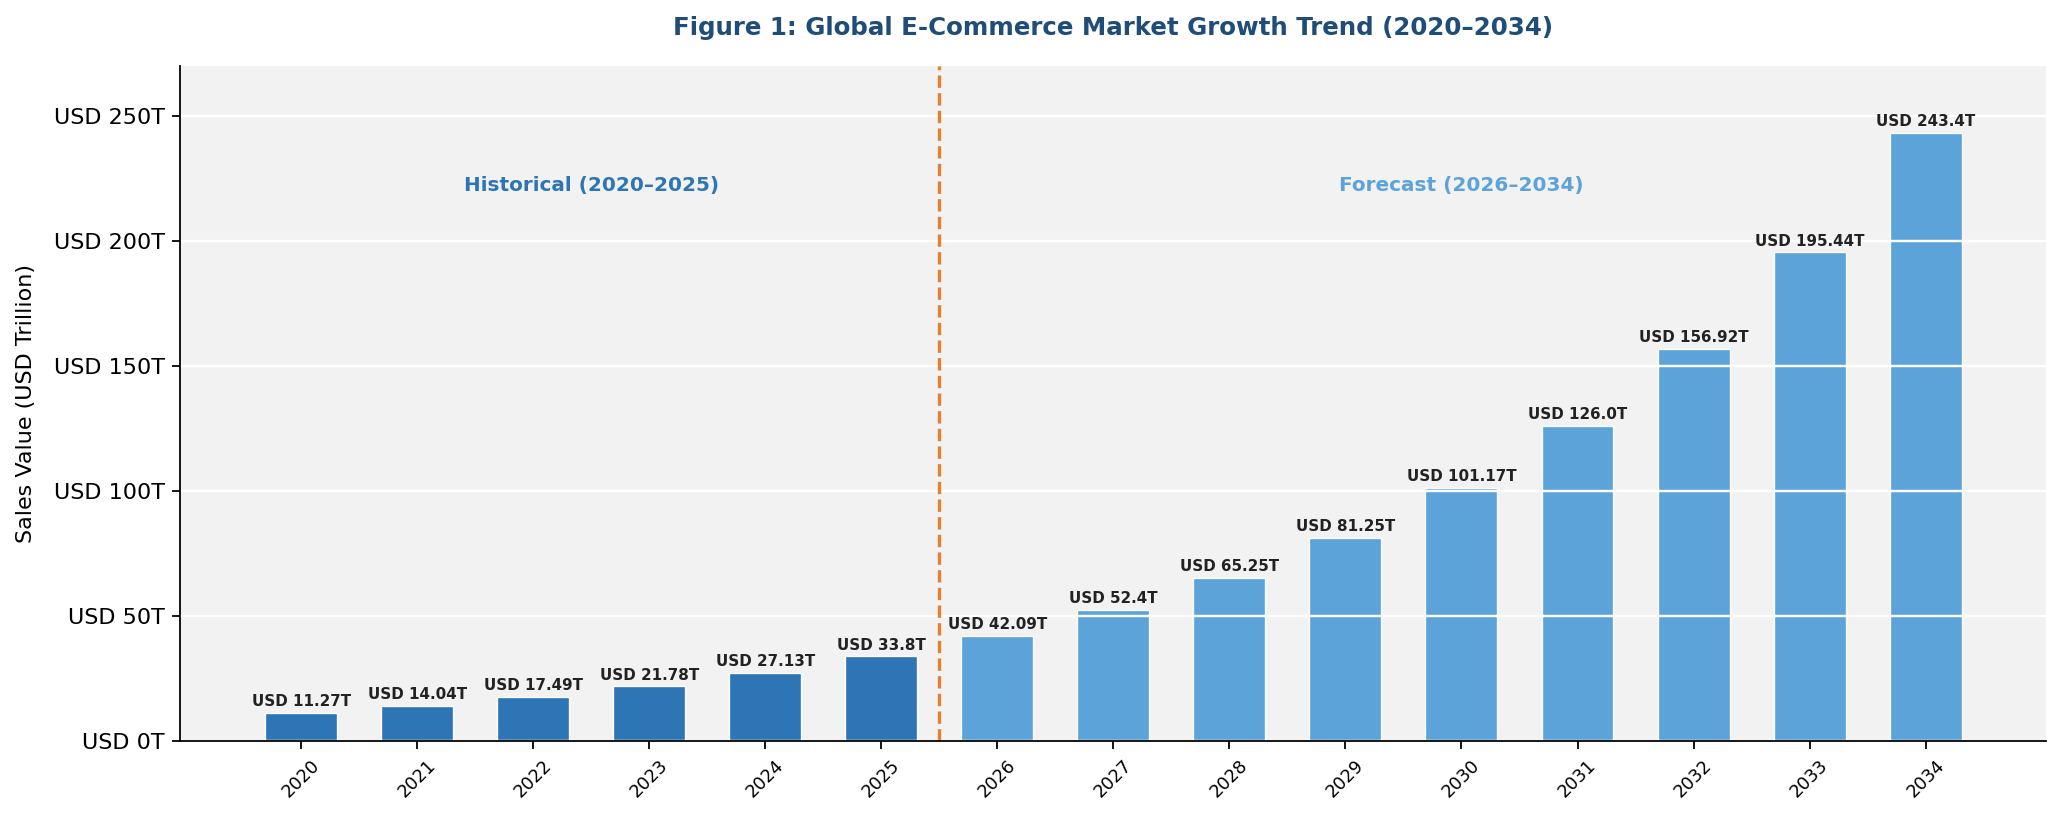
Figure 1: Global E-Commerce Market Growth Trend (2020–2034)
Segment-level CAGR comparisons highlight Groceries and B2B as the two fastest-growing sub-categories within the global e-commerce market industry analysis through 2034, supported by quick-commerce infrastructure and enterprise procurement digitization.
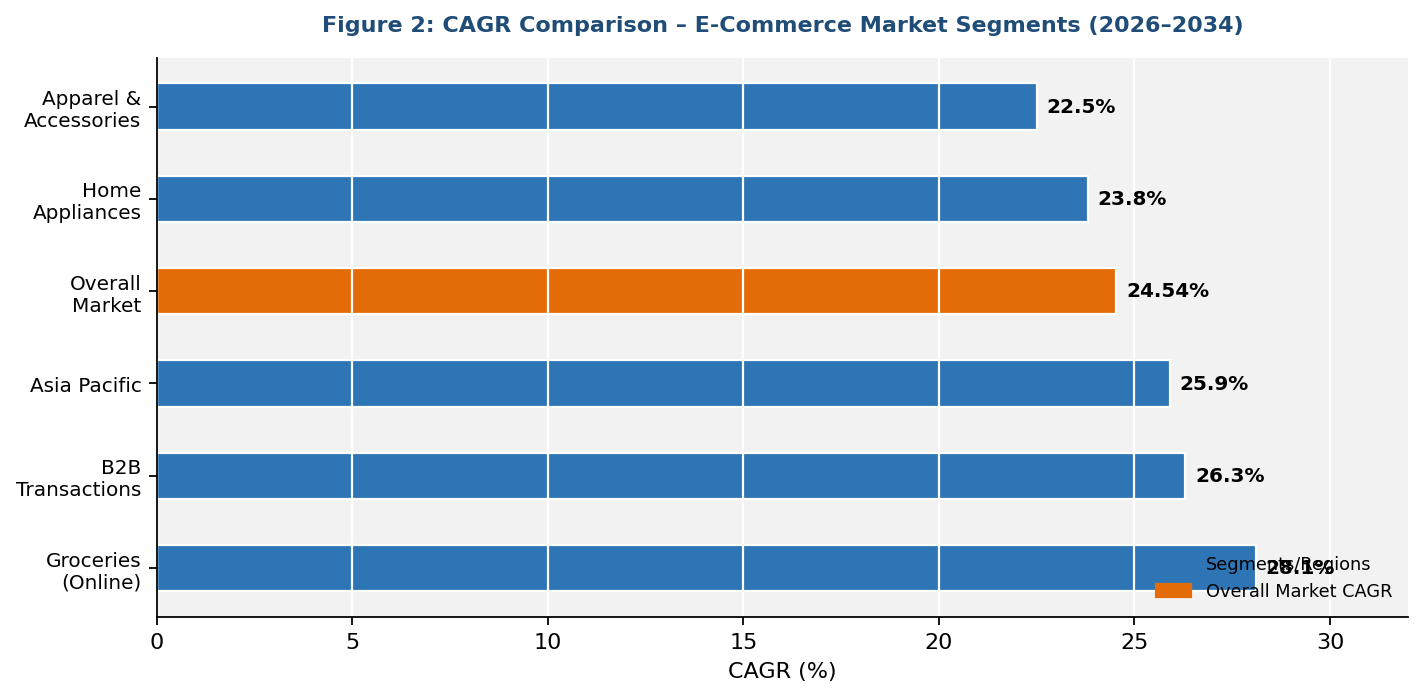
Figure 2: CAGR Comparison – E-Commerce Market Segments (2026–2034)
Executive Summary
The global e-commerce market is undergoing a structural transformation driven by the convergence of AI, mobile technology, and digital payments, reshaping how consumers and businesses transact worldwide. Valued at USD 33.80 Trillion in 2025, the market is forecast to reach USD 243.40 Trillion by 2034 at a CAGR of 24.54%.
Business-to-Business (B2B) commands the dominant transaction share at 46.7% in 2025, driven by enterprise procurement platform adoption, government e-invoicing mandates, and AI-enabled supply chain digitization across manufacturing, retail, and healthcare verticals. Home appliances lead the type segment at 28.4%, supported by smart-home technology proliferation, competitive online pricing, and expanding consumer financing options.
Asia Pacific dominates with a 54.3% global revenue share in 2025, led by China's 83% contribution to regional e-commerce sales, India's government-backed ONDC network expansion, and Southeast Asia's mobile-first consumer growth.
Key Market Insights
|
Insight |
Data |
|
Largest Transaction |
Business-to-Business (B2B) – 46.7% share (2025) |
|
Leading Type |
Home Appliances – 28.4% share (2025) |
|
Leading Region |
Asia Pacific – 54.3% revenue share (2025) |
|
Second Largest Region |
North America – 18.7% revenue share (2025) |
|
Fastest Growing Segment |
Groceries (Online) – Est. ~28.1% CAGR (2026-2034) |
|
Top Companies |
Amazon.com Inc., Alibaba Group Holding Limited, Walmart Inc. |
|
Market Opportunity |
USD 101.17 Trillion by 2030 → USD 243.40 Trillion by 2034; AI & social commerce driving incremental GMV |
Key analytical observations supporting the above data:
- Business-to-Business (B2B)'s 46.7% dominance in 2025 reflects the accelerating shift of enterprise procurement to digital platforms, with the global B2B e-commerce market valued at approximately USD 32.11 Trillion in 2025, growing at a CAGR of 14.5%.
- Home Appliances leads type at 28.4%, driven by smart-home adoption, competitive online pricing, BNPL financing, and robust reverse-logistics for high-value electronics.
- Asia Pacific's 54.3% global dominance is anchored by China (83% of APAC retail e-commerce), India's ONDC expansion, and Southeast Asia's mobile-first consumer surge, growing at over 20% annually.
- Online Groceries is the fastest-growing type as quick-commerce platforms (10-minute delivery models) emerge across India, China, and Europe, expanding the total addressable online grocery market.
- US total e-commerce sales reached USD 1,233.7 Billion in 2025 (US Census Bureau Q4 2025), with e-commerce representing 16.4% of total retail sales and social commerce projected to exceed USD 80 Billion.
Global E-Commerce Market Overview
E-commerce encompasses the buying and selling of goods and services through electronic channels—primarily internet-based platforms—spanning business-to-consumer (B2C), business-to-business (B2B), and consumer-to-consumer (C2C) transaction models. Modern e-commerce platforms integrate digital storefronts, AI-powered recommendation engines, secure payment gateways, logistics management, and customer service interfaces into unified ecosystems accessible via desktop, mobile, and smart-device channels.
Applications span retail, wholesale, cross-border trade, digital services, and subscription commerce across every major industry vertical. Macroeconomic enablers include rising internet penetration—with a multiple billion global online shoppers in 2025—expanding middle-class purchasing power in Asia Pacific and Latin America, and infrastructure investments in logistics and payments by both governments and private platforms.
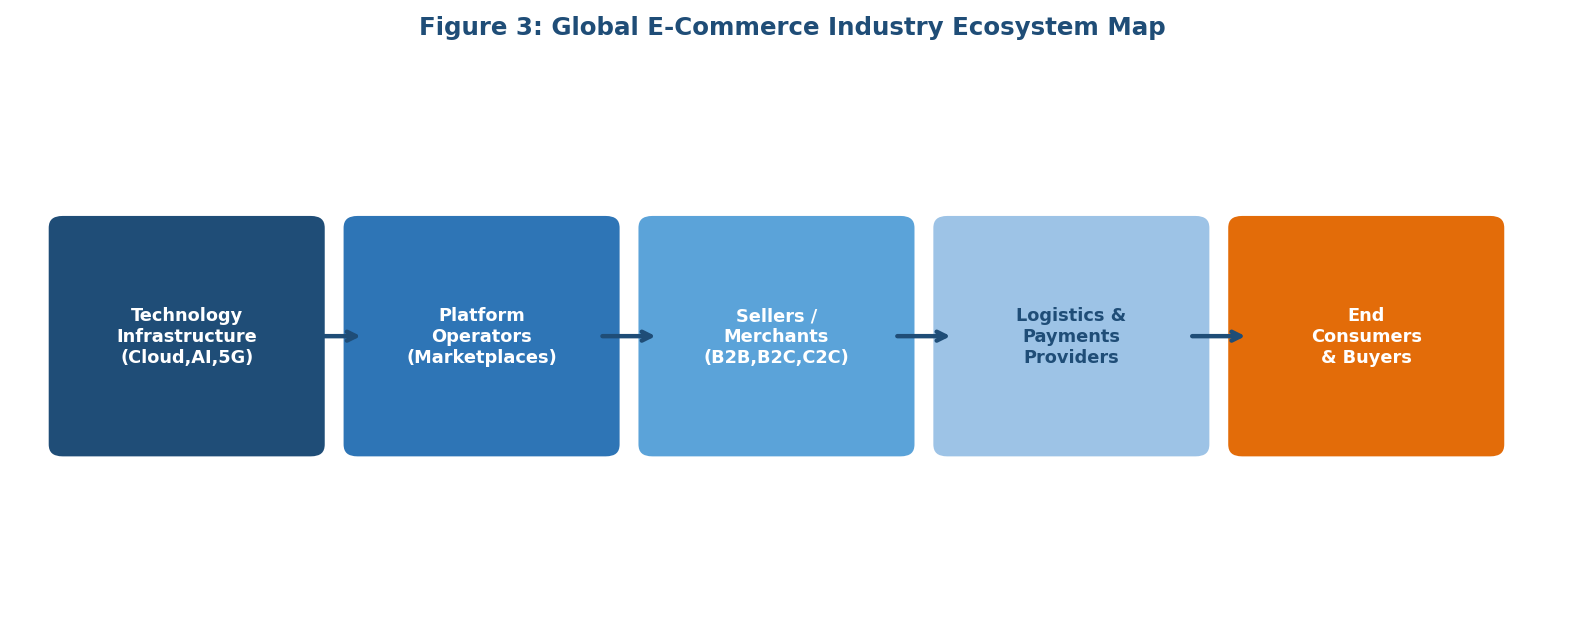
Figure 3: Global E-Commerce Industry Ecosystem Map
Market Dynamics
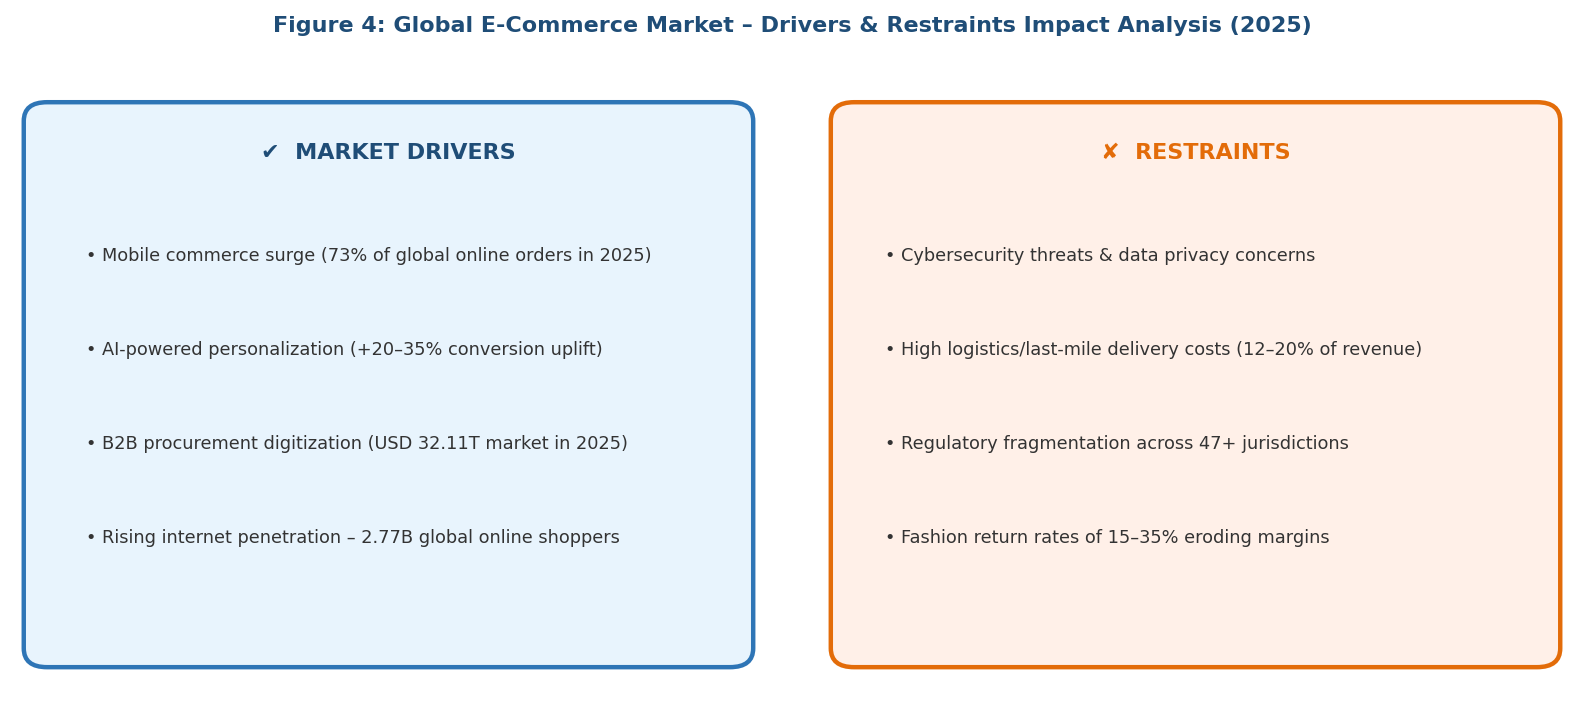
Figure 4: E-Commerce Market – Drivers & Restraints Impact Analysis (2025)
Market Drivers
- Mobile Commerce Surge: Smartphones are the primary driver of online shopping, making mobile-first optimization critical. Growth is fuelled by affordable devices and seamless mobile payment ecosystems, particularly in emerging markets.
- AI-Powered Personalization: AI is transforming e-commerce through personalized recommendations, automation, and intelligent shopping assistants, improving conversion rates and reducing friction across the purchase journey.
- Business-to-Business (B2B) Platform Digitization: Enterprises are rapidly shifting to digital procurement platforms, supported by e-invoicing mandates and streamlined cross-border trade processes.
- Cross-Border Trade Expansion: Favorable trade frameworks and direct-to-consumer models are accelerating cross-border e-commerce, enabling brands to access new international markets more efficiently.
Market Restraints
- Cybersecurity and data privacy threats: Increasing cyber threats and data protection requirements are driving higher security investments and operational complexity for e-commerce platforms.
- High return rates and logistics costs: Elevated return rates—especially in categories like fashion—combined with expensive last-mile delivery, are putting pressure on margins.
Market Opportunities
- Social commerce and live-streaming: Interactive, content-driven commerce models are enabling real-time purchasing and stronger consumer engagement.
- Quick-commerce and instant delivery infrastructure: Ultra-fast delivery infrastructure is increasing purchase frequency and redefining consumer expectations around convenience.
- Emerging market first-time buyer onboarding: Rising internet penetration and digital adoption in developing regions are unlocking a large base of first-time online shoppers.
Market Challenges
- Regulatory fragmentation: Diverse and evolving regulations across markets are increasing compliance burdens, particularly for cross-border operations.
- AI agent ecosystem conflicts: Platforms including Shopify and Amazon are beginning to resist external AI agent activity, creating friction in the emerging agentic commerce landscape and potential revenue model disruption for brands dependent on sponsored placements.
Emerging Market Trends
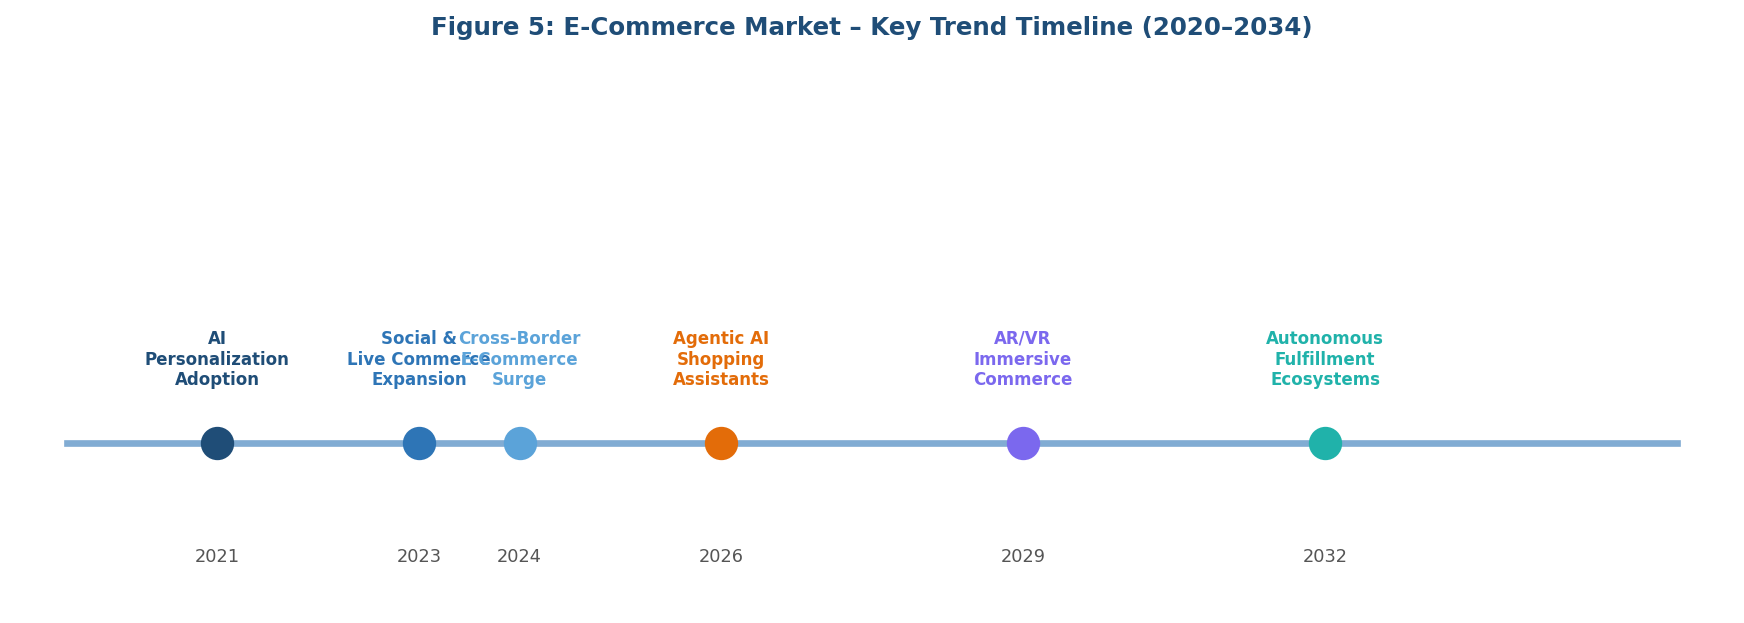
Figure 5: E-Commerce Market – Key Trend Timeline (2020–2034)
1. Agentic AI and Autonomous Shopping Assistants
AI is evolving from passive recommendation tools to active transactional agents. Platforms are introducing AI assistants capable of monitoring prices, making purchase decisions, and executing transactions on behalf of users. This marks a shift toward autonomous, intent-driven commerce, reducing friction across the buying journey.
2. Social Commerce and Live-Streaming Shopping Revolution
Social commerce has become a mainstream sales channel, driven by influencer-led discovery, live-streaming, and interactive shopping formats. These models compress the discovery-to-purchase cycle and significantly enhance user engagement, particularly among younger, mobile-first consumers.
3. Cross-Border E-Commerce and Supply Chain Localization
Cross-border e-commerce is expanding rapidly, supported by improving digital trade frameworks and direct-to-consumer models. At the same time, companies are investing in localized fulfilment and distributed inventory networks to reduce delivery timelines and manage regulatory and tariff complexities.
4. Quick Commerce and Ultra-Fast Grocery Delivery
Quick commerce is reshaping urban retail through ultra-fast delivery models enabled by micro-warehousing and dense logistics networks. E-commerce players are prioritizing speed and convenience, particularly in grocery and essential categories, to capture high-frequency consumption.
5. Sustainable and Circular E-Commerce (ReCommerce)
Sustainability is becoming a core driver of consumer choice, accelerating the growth of recommerce models such as resale, refurbished, and pre-owned goods. Platforms are increasingly integrating circular economy initiatives to meet consumer expectations and strengthen long-term value propositions.
Industry Value Chain Analysis
The e-commerce value chain spans six integrated stages from digital infrastructure provision through end-consumer delivery. Each stage presents distinct competitive dynamics, investment requirements, and margin profiles.
|
Stage |
Key Players / Examples |
|
Digital Infrastructure |
AWS, Google Cloud, Microsoft Azure, Akamai, Cloudflare |
|
Platform Developers |
Shopify, Magento (Adobe Commerce), BigCommerce, WooCommerce |
|
Marketplace Operators |
Amazon, Alibaba (Taobao/Tmall), JD.com, eBay, Flipkart, Walmart Marketplace |
|
Logistics & Fulfillment |
UPS, FedEx, DHL, Cainiao (Alibaba), Amazon Logistics, XPO |
|
Payments & Fintech |
PayPal, Stripe, Alipay, Klarna (BNPL), Razorpay, Adyen |
|
End Consumers / Buyers |
Individual shoppers (B2C), SMEs and enterprises (B2B), peer-to-peer sellers (C2C) |
Marketplace operators occupy the highest strategic value position, integrating platform technology, merchant ecosystems, logistics networks, and financial services into vertically integrated commerce engines. However, platform-level power is increasingly challenged by direct-to-consumer (D2C) brands leveraging Shopify's infrastructure to bypass marketplace commission structures and build proprietary customer relationships.
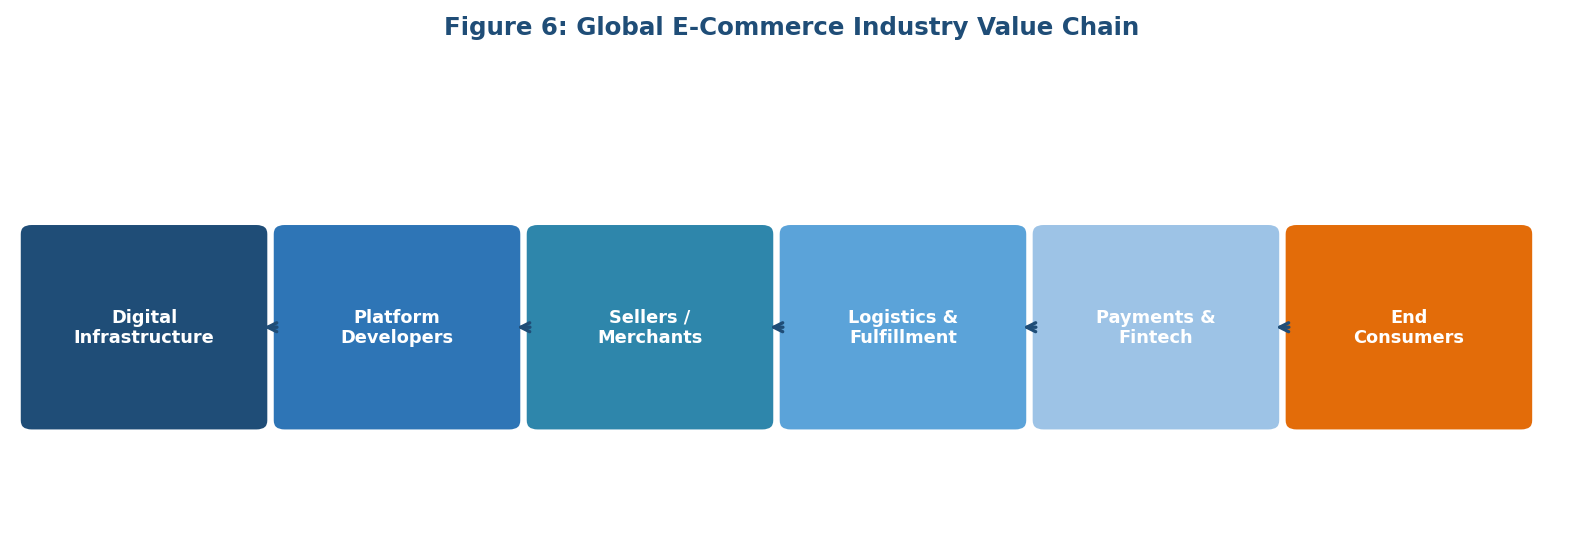
Figure 6: Global E-Commerce Industry Value Chain
Technology Landscape in the E-Commerce Industry
Artificial Intelligence and Machine Learning
AI is the defining technology in e-commerce, driving personalization, automation, and decision-making. Key applications include recommendation engines, chatbots, demand forecasting, dynamic pricing, and emerging agentic purchasing systems. AI-led inventory management is improving supply-demand alignment, reducing inefficiencies, and enhancing operational performance.
Mobile Commerce and Payment Technologies
Mobile commerce dominates digital transactions, supported by faster connectivity, app-like web experiences, and seamless payment solutions. Mobile wallets and one-tap checkout are streamlining user journeys, while buy-now-pay-later models are boosting purchase flexibility. Alternative payment methods, including digital assets, are gradually emerging in select markets.
Augmented Reality and Immersive Commerce
AR is transforming online shopping by enabling virtual product visualization, particularly in fashion and home categories. Virtual try-on and 3D visualization tools are improving purchase confidence, reducing returns, and increasing conversion rates. Immersive commerce is evolving as a key differentiator in enhancing the digital shopping experience.
Market Segmentation Analysis
By Type
Home Appliances commands a 28.4% majority share in 2025, reflecting the industry-wide acceleration of smart-home technology adoption and the consumer shift to purchasing large domestic appliances—refrigerators, washing machines, air conditioners—through digital channels offering competitive pricing, EMI financing, and reliable warranty services.
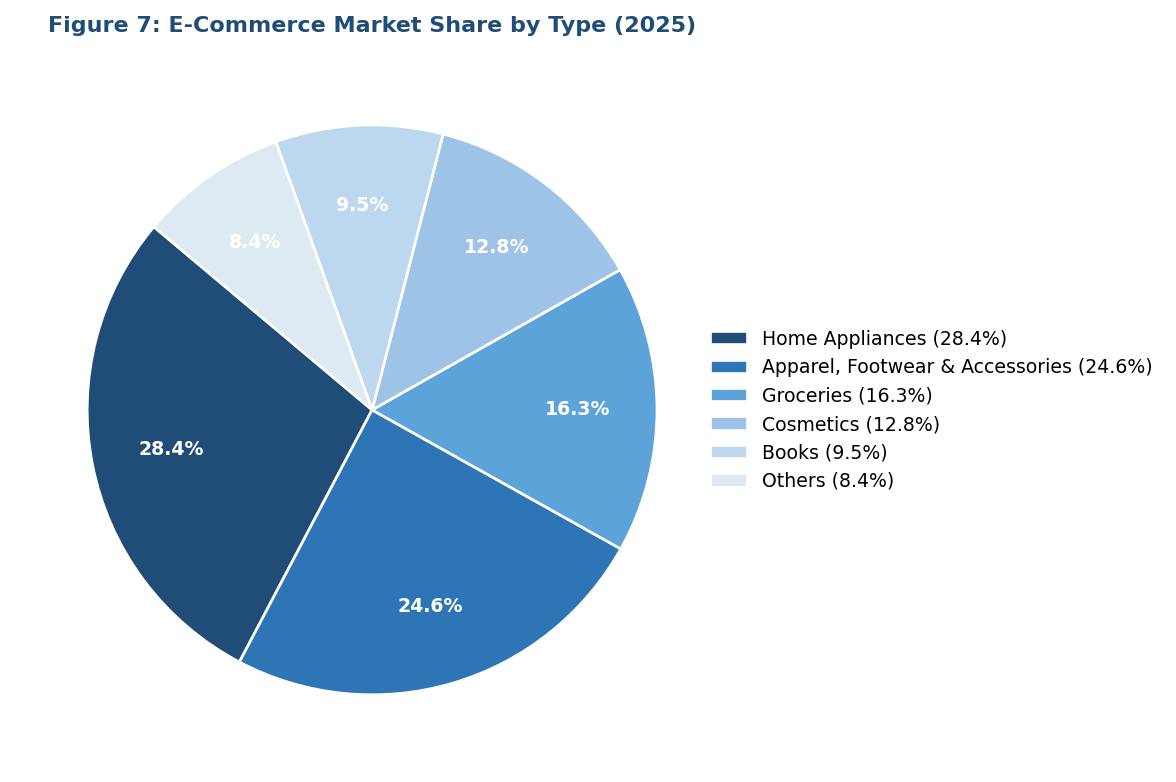
Figure 7: E-Commerce Market Share by Type (2025)
Apparel, Footwear, and Accessories at 24.6% in 2025, driven by social commerce impulse purchasing, AR virtual try-on reducing return friction, and influencer-led fashion discovery on TikTok Shop and Instagram. Groceries at 16.3% is the fastest-growing product segment, powered by quick-commerce infrastructure expansion. Cosmetics at 12.8% benefits from personalized beauty AI tools and influencer marketing reach. Books at 9.5% reflects the maturity of digital content migration.
By Transaction
Business-to-Business (B2B) dominates at 46.7% in 2025, driven by enterprise procurement digitization, government e-invoicing mandates, and AI-powered procurement analytics platforms reducing purchase cycle times by up to 60%.
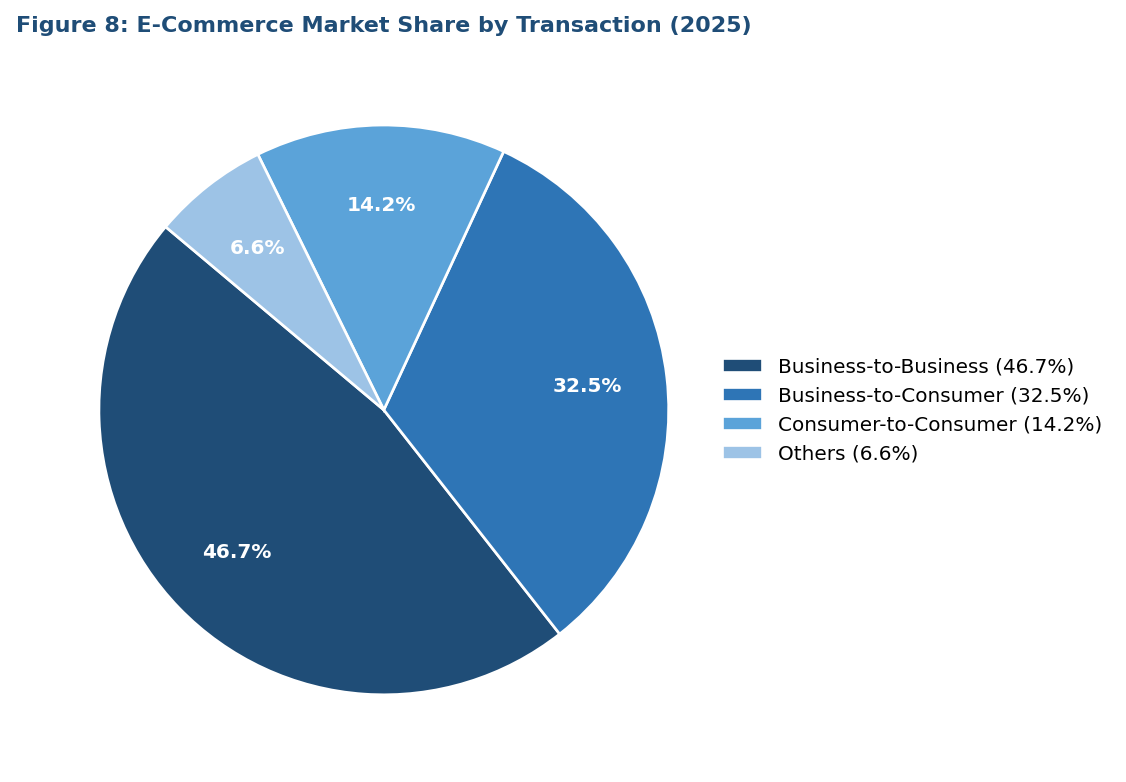
Figure 8: E-Commerce Market Share by Transaction (2025)
Business-to-Consumer (B2C) at 32.5% in 2025 represents the highest-visibility segment, anchored by global marketplace giants and D2C brand growth. Consumer-to-Consumer (C2C) at 14.2% is expanding through recommerce, peer-to-peer resale platforms, and social selling ecosystems, reflecting growing circular economy adoption globally.
Regional Market Insights
|
Region |
Share (2025) |
Key Growth Drivers |
|
Asia Pacific |
54.3% |
China NEV/tech boom, India ONDC + 5G, SE Asia mobile-first, RCEP cross-border |
|
North America |
18.7% |
US USD 1.2T+ market, AI personalization, same-day delivery, social commerce USD 80B+ |
|
Europe |
15.6% |
B2B GMV USD 1.8T (2025), GDPR-compliant platforms, recommerce growth, UK/DE/FR leadership |
|
Latin America |
6.2% |
Brazil + Mexico leaders, fintech-embedded commerce, mobile-first, MercadoLibre EBITDA growth |
|
Middle East & Africa |
5.2% |
GCC has high digital payment penetration, Saudi Vision 2030, and mobile wallet expansion in Sub-Saharan Africa |
Asia Pacific commands a 54.3% global revenue share in 2025, the most dominant regional position in the global e-commerce market. China is the single most critical national market—with China accounting for 83% of APAC retail e-commerce sales—combining the world's largest population of digital buyers with the most advanced live-commerce and AI personalization ecosystems globally.
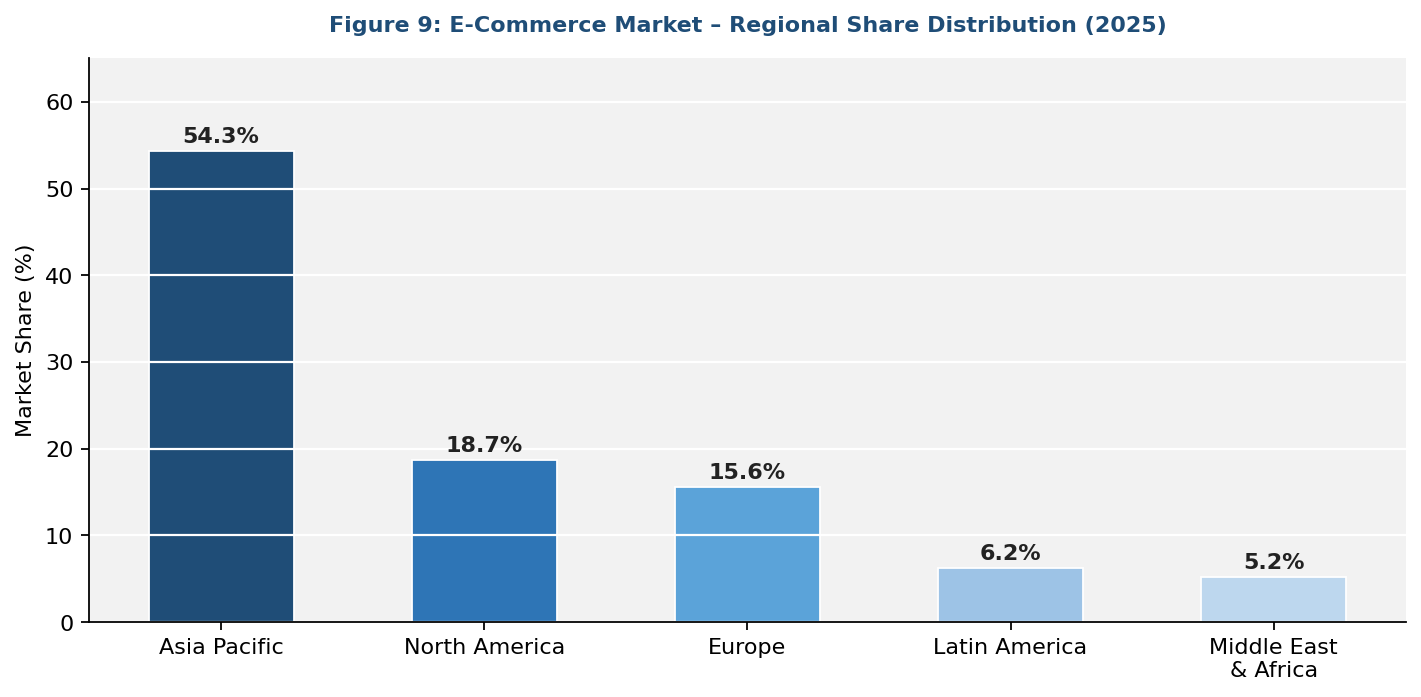
Figure 9: E-Commerce Market – Regional Share Distribution (2025)
North America, with 18.7% in 2025, is anchored by the US market. Canada's advanced logistics and regulatory environment, alongside Mexico's growing platform adoption, complete the regional profile.
Europe's e-commerce landscape is defined by strong regulatory frameworks, cross-border marketplace expansion, and progressive digital payment infrastructure. Latin America is a high-growth frontier, with Sea Ltd.'s Shopee reporting EBITDA profit. The Middle East and Africa represent an emerging e-commerce frontier, driven by GCC digital payment adoption and Saudi Arabia's Vision 2030 investments.
Competitive Landscape
|
Company Name |
Key Platform / Brand |
Market Position |
Core Strength |
|
Amazon.com Inc. |
Amazon Prime / Amazon Business |
Leader |
Major US market share; AI Rufus, AWS cloud, same-day Prime delivery |
|
Alibaba Group Holding Limited |
Taobao / Tmall / AliExpress |
Leader |
900M+ consumers in China; Cainiao logistics, Alipay, quick-commerce |
|
Walmart Inc. |
Walmart Marketplace / Sam's Club |
Leader |
Targeting 25% e-commerce revenue share by FY2030; grocery-led model |
|
JD.com Inc. |
JD.com / JD Health |
Leader |
127 autonomous delivery patents; high-speed logistics in China |
|
Shopify Inc. |
Shopify / Shopify Capital |
Leader |
175+ countries |
|
eBay Inc. |
eBay / eBay Refurbished |
Niche |
C2C and recommerce leadership |
|
Zalando SE |
Zalando / Zircle (pre-owned) |
Challenger |
Europe's largest fashion platform; 3D avatar virtual fitting room |
|
Best Buy Co., Inc. |
BestBuy.com / Geek Squad |
Niche |
US electronics omnichannel; strong tech category specialist presence |
|
Groupon Inc. |
Groupon / Groupon Goods |
Niche |
Deal and coupon marketplace; SMB service e-commerce and local deals |
The global e-commerce competitive landscape is characterized by a small number of platform giants commanding dominant GMV shares, with Amazon controlling ~40% of US online retail and Alibaba serving 900+ million consumers in China. Competition is increasingly defined by fulfilment speed, AI personalization depth, social commerce integration, and embedded financial services.
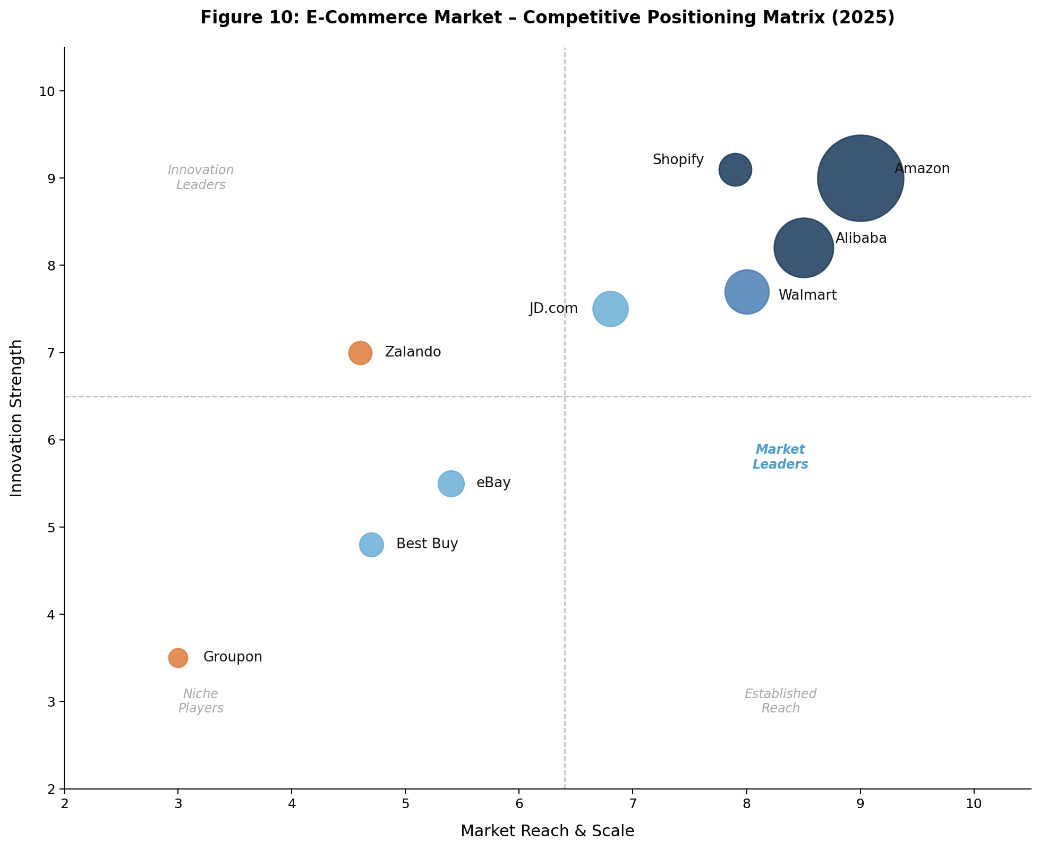
Figure 10: E-Commerce Market – Competitive Positioning Matrix (2025)
Key Company Profiles
Amazon.com Inc.
Amazon is an e-commerce marketplace and operates in over 20 countries. Its Prime membership ecosystem—combining fast shipping, streaming, and exclusive deals—creates high-retention customer loyalty at scale.
- Product & Platform Portfolio: Amazon Marketplace, Amazon Business (B2B), Amazon Prime, Alexa/Rufus AI, Amazon Fresh, AWS Commerce.
- Recent Developments: In November 2025, Amazon expanded AI-led commerce capabilities, including the development of agentic shopping assistants enabling automated purchasing decisions.
- Strategic Focus: Amazon's strategy centres on AI-first shopping experiences (Rufus), logistics network densification for same-day and 10-minute delivery, AWS-powered merchant personalization, and expanding Amazon Business GMV beyond USD 83 Billion by 2025.
Alibaba Group Holding Limited
Alibaba is China's dominant e-commerce ecosystem operator, serving over 900 million consumers.
- Product & Platform Portfolio: Taobao Live, Tmall Global, AliExpress, Alibaba.com B2B, Cainiao logistics, Alipay, Ant Financial.
- Recent Developments: In March 2026, Alibaba reported strong growth in AI and cloud businesses, driven by increasing adoption of AI-related products and services.
- Strategic Focus: Alibaba's strategy integrates AI across all commerce and cloud operations, positions quick-commerce as the customer acquisition engine, and leverages Cainiao's automated fulfilment hubs for cross-border expansion throughout the Asia Pacific and Europe.
Shopify Inc.
Shopify is the commerce platform, enabling independent merchants and D2C brands to build, operate, and scale online stores across 175+ countries. Unlike marketplace models, Shopify empowers brands to maintain direct customer relationships.
- Product & Platform Portfolio: Shopify Storefront, Shopify Payments, Shopify Capital, Shopify Fulfillment Network, Shop App, Shopify POS.
- Recent Developments: In February 2026, Shopify issued strong revenue forecasts and highlighted rapid growth in AI-driven commerce tools, with increasing adoption among both SMBs and enterprise clients.
- Strategic Focus: Shopify's strategy prioritises composable commerce architecture, enabling brands to deploy independently scalable storefronts, AI-powered merchant tools for SEO and product listings, and B2B marketplace expansion through its Faire wholesale partnership and Shopify B2B product suite.
Market Concentration Analysis
The global e-commerce market exhibits high concentration at the platform tier, with Amazon.com Inc., Alibaba Group Holding Limited, and JD.com Inc. collectively commanding an estimated 45–55% of global marketplace GMV in 2025. The top five platforms—adding Walmart and Shopify—capture approximately 60–65% of total marketplace-driven retail sales worldwide.
A bifurcated structural dynamic defines the market. At the large-enterprise platform tier, consolidation is accelerating: AI investment requirements, logistics infrastructure costs, and regulatory compliance demands create high barriers that reinforce the incumbents' advantages. Simultaneously, emerging markets and vertical niches are fragmenting and aggressively scaling internationally, while niche vertical marketplaces in beauty, pet care, and B2B industrial goods are capturing disproportionate growth by offering curated, specialist experiences.
Recommerce and sustainability-focused platforms—including eBay Inc., Zalando SE, and Best Buy Co., Inc. —represent a fast-growing, fragmented tier as circular economy adoption accelerates globally, creating meaningful market space outside the dominant platform ecosystems.
Investment & Growth Opportunities
Fastest-Growing Segments
Online groceries are the fastest-growing segment, driven by rapid quick-commerce expansion and rising demand for convenience. AI-enabled personalization is a key value driver, improving engagement, conversions, and basket size.
Emerging Market Expansion
Southeast Asia remains a high-growth region, led by increasing digital adoption in Indonesia, Vietnam, and the Philippines. India’s ONDC is enhancing competition and SME participation, while Sub-Saharan Africa is gaining traction through telecom-led mobile commerce.
Venture & Private Investment Trends
Investments are concentrated in AI-driven shopping, quick-commerce logistics, and embedded fintech. Embedded finance is strengthening platform ecosystems, while social commerce in Southeast Asia continues to attract strong investor interest.
Future Market Outlook (2026-2034)
The global e-commerce market forecast projects sustained high-value expansion from USD 33.80 Trillion in 2025 to USD 243.40 Trillion by 2034 at a CAGR of 24.54%—a more than 7x growth in market value underpinned by structural B2B platform adoption, mobile-first consumer onboarding in emerging markets, and AI-driven commerce automation across all transaction types.
Three technology discontinuities are most likely to reshape the e-commerce market through 2034. First, agentic AI commerce, where autonomous AI systems execute end-to-end purchasing on behalf of consumers and enterprise buyers, will restructure the platform-consumer interface fundamentally by 2028–2030, potentially displacing traditional search advertising as the primary product discovery mechanism. Second, immersive commerce—combining AR virtual try-on, live-streaming, and spatial computing—will compress the B2C product consideration-to-purchase funnel dramatically, particularly in fashion, beauty, and home furnishings. Third, embedded B2B procurement ecosystems leveraging real-time e-invoicing, AI demand forecasting, and supply chain finance will digitize the final manual procurement holdouts in industrial and government sectors.
By 2034, the global e-commerce industry is forecast to complete its transformation from a transactional retail channel into the dominant global trade infrastructure. Platform competition will shift from GMV scale to AI infrastructure depth, logistics network density, and regulatory compliance capability across an increasingly complex multi-jurisdictional digital trade landscape.
Research Methodology
Primary Research
Primary research encompassed structured interviews conducted in 2024–2025 with e-commerce industry stakeholders, including category directors at major marketplace operators, B2B procurement platform product managers, payment gateway technology leads, last-mile logistics executives, and institutional investors in digital commerce. Primary insights validated market sizing, segmentation estimates, technology adoption timelines, and competitive positioning assessments.
Secondary Research
Secondary sources include the US Census Bureau Quarterly Retail E-Commerce Sales reports, the UNCTAD E-Commerce Report 2025–2026, GSMA Mobile Economy reports, World Bank Digital Commerce data, ITC Trade Map cross-border commerce data, company annual reports (Amazon, Alibaba, Shopify, JD.com, Walmart), trade publications including Digital Commerce 360, eMarketer, and Statista, and government regulatory publications from PEPPOL, EU DSA, and ASEAN DEFA.
Forecasting Models
Market size estimations and growth projections were derived using a combination of top-down and bottom-up forecasting models, incorporating GDP growth rates, internet penetration indices, digital payment adoption rates, and historical market evolution patterns. Scenario analysis (base, optimistic, and conservative cases) was performed to account for macroeconomic uncertainty, including tariff policy volatility and AI adoption pace variation.
E-commerce Market Report Scope:
| Report Features | Details |
|---|---|
| Base Year of the Analysis | 2025 |
| Historical Period | 2020-2025 |
| Forecast Period | 2026-2034 |
| Units | Trillion USD |
| Scope of the Report | Exploration of Historical Trends and Market Outlook, Industry Catalysts and Challenges, Segment-Wise Historical and Predictive Market Assessment:
|
| Types Covered | Home Appliances, Apparel, Footwear and Accessories, Books, Cosmetics, Groceries, Others |
| Transactions Covered | Business-To-Consumer, Business-To-Business, Consumer-To-Consumer, Others |
| Regions Covered | Asia Pacific, Europe, North America, Latin America, Middle East and Africa |
| Countries Covered | United States, Canada, Germany, France, United Kingdom, Italy, Spain, Russia, China, Japan, India, South Korea, Australia, Indonesia, Brazil, Mexico |
| Companies Covered | Amazon.com Inc., Alibaba Group Holding Limited, Walmart Inc., JD.com Inc., Shopify Inc., eBay Inc., Zalando SE, Best Buy Co., Inc., Groupon Inc., etc. |
| Customization Scope | 10% Free Customization |
| Post-Sale Analyst Support | 10-12 Weeks |
| Delivery Format | PDF and Excel through Email (We can also provide the editable version of the report in PPT/Word format on special request) |
Key Benefits for Stakeholders:
- IMARC’s industry report offers a comprehensive quantitative analysis of various market segments, historical and current market trends, market forecasts, and dynamics of the e-commerce market from 2020-2034.
- The research report provides the latest information on the market drivers, challenges, and opportunities in the global e-commerce market.
- The study maps the leading, as well as the fastest-growing, regional markets. It further enables stakeholders to identify the key country-level markets within each region.
- Porter's five forces analysis assist stakeholders in assessing the impact of new entrants, competitive rivalry, supplier power, buyer power, and the threat of substitution. It helps stakeholders to analyze the level of competition within the e-commerce industry and its attractiveness.
- Competitive landscape allows stakeholders to understand their competitive environment and provides an insight into the current positions of key players in the market.
Key Questions Answered in This Report
The global e-commerce market was valued at USD 33.80 Trillion in 2025, including business-to-business, business-to-consumer, and consumer-to-consumer transactions across all product categories and digital channels worldwide.
The market is projected to reach USD 243.40 Trillion by 2034, growing at a CAGR of 24.54% during 2026-2034, driven by B2B digitization, AI commerce, and mobile-first consumer growth in emerging markets.
Business-to-Business dominates at 46.7% in 2025, driven by enterprise procurement platform adoption and government e-invoicing mandates accelerating SME onboarding globally.
Home Appliances leads with a 28.4% share in 2025, supported by smart-home adoption, online competitive pricing, and consumer financing options (BNPL, EMI), reducing purchase barriers.
Asia Pacific leads with a 54.3% share in 2025, anchored by China (83% of APAC retail e-commerce), India's ONDC growth, and Southeast Asia's mobile-first consumer explosion.
Key drivers include mobile commerce surge (73% of orders via smartphones), AI-powered personalization, B2B procurement digitization, cross-border trade frameworks, and social commerce expansion.
Online Groceries is the fastest-growing product segment at ~28.1% CAGR, fuelled by quick-commerce (10-minute delivery) infrastructure investments by Alibaba, Amazon, and venture-backed platforms in India and China.
Leading companies include Amazon.com Inc., Alibaba Group Holding Limited, Walmart Inc., JD.com Inc., Shopify Inc., eBay Inc., Zalando SE, Best Buy Co., Inc., and Groupon Inc.
Need more help?
- Speak to our experienced analysts for insights on the current market scenarios.
- Include additional segments and countries to customize the report as per your requirement.
- Gain an unparalleled competitive advantage in your domain by understanding how to utilize the report and positively impacting your operations and revenue.
- For further assistance, please connect with our analysts.
 Request Customization
 Speak to an Analyst
 Request Brochure
 Inquire Before Buying
Benefits of Customization
- Personalize this research
- Triangulate with your data
- Get data as per your format and definition
- Gain a deeper dive into a specific application, geography, customer, or competitor
- Any level of personalization
Get in Touch With Us
UNITED STATES
Phone: +1-201-971-6302
INDIA
Phone: +91-120-433-0800
UNITED KINGDOM
Phone: +44-753-714-6104
Email: sales@imarcgroup.com
Client Testimonials


.webp)


