
Australia Public Transport Systems Market Report by Mode of Transport (Rail Transport, Bus Transport, Ferry Transport, On-Demand and Shared Mobility Services), Ownership (Government/Public-Owned Services, Privately Owned/Contracted Services, Public-Private Partnerships (PPP)), and Region 2026-2034
Australia Public Transport Systems Market Overview:
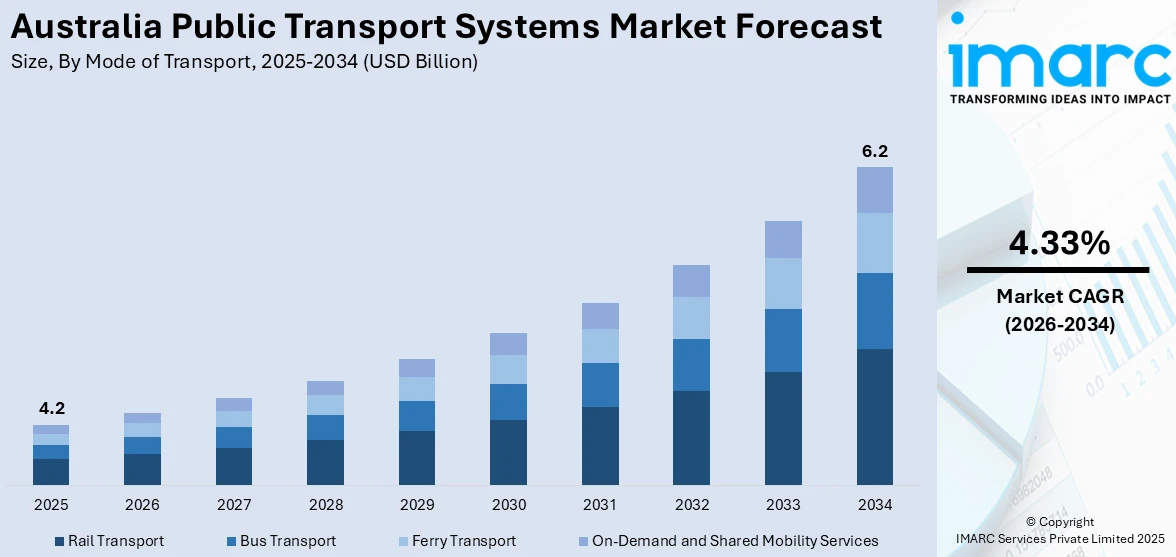
The Australia public transport systems market size reached USD 4.2 Billion in 2025. Looking forward, the market is expected to reach USD 6.2 Billion by 2034, exhibiting a growth rate (CAGR) of 4.33% during 2026-2034. The market is driven by the growing traffic congestion that increases the travel time of commuters, along with air pollution problems leading to high rates of respiratory and cardiovascular diseases (CVDs).
|
Report Attribute
|
Key Statistics
|
|---|---|
|
Base Year
|
2025
|
|
Forecast Years
|
2026-2034
|
|
Historical Years
|
2020-2025
|
| Market Size in 2025 | USD 4.2 Billion |
| Market Forecast in 2034 | USD 6.2 Billion |
| Market Growth Rate 2026-2034 | 4.33% |
Key Trends of Australia Public Transport Systems Market:
Traffic Congestion
According to the news published on the website of the Australian Broadcasting Corporation (ABC), the number of vehicles per person had grown to 810 per 1,000 people in 2023. With more cars on the road, areas like Sydney, Melbourne, and Brisbane, are facing substantial traffic congestion. Public transportation networks provide a reliable and faster alternative in crowded traffic, encouraging commuters to use trains, buses, and trams. Public transportation systems that follow set routes and schedules, such as dedicated bus lanes or rail lines, offer a more efficient option with predictable trip times, thereby expanding the use of public transportation in the country. Private car use is putting an increasing strain on urban infrastructure like roads and highways. In response to traffic congestion, governing agencies in Australia are also implementing policies to promote public transport usage. These include congestion pricing, parking restrictions, and investments in expanding public transport services, such as building new metro lines, bus rapid transit (BRT) systems, and integrating transportation networks to provide seamless travel options.
To get more information on this market Request Sample
Air Pollution
As per the UNSW Sydney website, more than 3,200 deaths are being recorded every year in Australia due to air pollution. Air pollution, particularly in major cities, are associated with greater rates of respiratory and cardiovascular disease (CDVs). Public awareness about these health dangers is promoting a move away from private vehicles and toward public transportation, which creates fewer emissions per passenger and lowers overall pollution levels. The government in Australia is setting lofty targets for lowering carbon emissions and combatting climate change. Expanding and upgrading public transportation is a crucial technique for achieving these objectives. Investments in electric buses, light rail, and other low-emission modes of transportation contribute to air pollution reduction, which aligns with environmental goals. To combat pollution, communities are promoting sustainable transportation options, such as public transportation, biking, and walking.
Growth Drivers of Australia Public Transport Systems Market:
Urbanization and Rapid Population Expansion
One of the key drivers of the public transport systems market in Australia is the rapid population expansion and urbanization of major metropolitan cities like Sydney, Melbourne, Brisbane, and Perth. These metropolitan cities are witnessing steady population growth, consequently leading to growing demand for efficient, reliable, and high-capacity transport solutions. As urban sprawl spreads and residential developments move further into outer suburbs, the demand for convenient public transport grows more critical. Public transport networks alleviate traffic congestion on roads and minimize the use of private cars, especially when traveling during peak hour commuting times. Governments in cities such as Melbourne and Sydney are investing heavily in extending metro rail lines, tram routes, and bus corridors to serve increased commuter demands. Infrastructure planning today revolves around bringing together modes of transport to provide optimal connectivity, and to make public transport desirable to larger numbers of people. This city change, combined with land use planning that prioritizes transport-oriented development, continues to stimulate considerable investment and ingenuity in Australia public transport systems market share.
Government Infrastructure Investment and Policy Support
Strong government infrastructure investment and policy support are major drivers of growth within the market for Australia's public transport systems. Federal and state governments have both made large investments in extending and upgrading public transport networks. Projects like Melbourne Metro Tunnel, Sydney Metro, and Cross River Rail in Brisbane reflect the government's future orientation toward sustainable mobility. These projects are alleviating existing capacity bottlenecks while also future-proofing transport systems for generations to come. Strategic policy schemes such as the National Urban Transport Strategy, are focused on integrated transport planning, low-emission solutions, and intelligent mobility technologies. Public-private partnerships are also being utilized to finance and run mass-scale transport infrastructure, promoting innovation and efficiency. Moreover, the carbon emissions reduction drive aligns with policies promoting the usage of public transport instead of private automobiles. This robust political and economic support has provided a favorable climate for Australia public transport systems market growth and development.
Environmental Issues and Transition to Sustainable Mobility
Environmental concerns and the increasing demand for sustainable lifestyles are also fueling the expansion of public transport systems in Australia. Given that transport is among the biggest causes of greenhouse gas emissions in the country, there is a strong national focus on minimizing environmental footprints through cleaner and greener modes of transport. Cities are actively encouraging public transport as a cleaner option to private car usage, complemented by measures like electrifying bus fleets, investing in light rail networks, and promoting multimodal travel involving cycling and walking. Australia's commitment to global climate agreements and net-zero emissions goals further supports the shift toward low-emission transport infrastructure. Urban planners are also increasingly developing communities with public and active transport modes as top priorities, which helps eliminate the requirement for car dependence. This green focus helps the planet, along with public health and livability in cities, which are issues that are profoundly shaping public opinion and driving increased use of public transport nationwide.
Australia Public Transport Systems Market Dynamics:
Changing Commuter Habits and Lifestyle
The trends influencing Australia public transport systems market demand, increasingly revolve around changing commuter habits and evolving urban lifestyles. With more Australians requiring flexibility, affordability, and sustainability in their everyday journeys, interest has built in multimodal transport solutions that integrate trains, buses, ferries, trams, and active transport such as cycling. It has resulted in demands for connected and user-centric systems, leading operators to simplify ticketing, scheduling, and routing through digital systems. The emergence of hybrid work patterns has similarly changed travel habits, decreasing peak-hour congestion yet growing demand for out-of-peak services and inter-suburban travel. Transit agencies in cities such as Melbourne and Brisbane are testing on-demand public transport services and micro transit solutions to meet varied commencing needs. These behavioral changes are remodeling infrastructure development and service planning, compelling the public transport operators to place equal emphasis on convenience, flexibility, and personalization, in addition to capacity and reliability.
Technological Integration and Smart Mobility Solutions
Technology is central to redefining the market dynamics of Australia's public transportation systems. Smart mobility solutions like real-time tracking, contactless payments, mobility-as-a-service (MaaS) platforms, and data-driven service optimization are revolutionizing the commuter experience. Places such as Sydney have been pioneers of contactless payment systems on various modes of transport, greatly enhancing convenience and efficiency. The use of artificial intelligence and data analytics enables operators to maximize schedules, control capacity, and react dynamically to changes in demand. Moreover, real-time passenger information systems are now common in nearly all urban areas, allowing travelers to get accurate updates and enhancing journey planning. These innovations are enhancing customer satisfaction while also maximizing the operational efficiency of providers. The drive toward linked, smart transport networks is likely to build momentum, with increased cooperation between technology companies, government authorities, and transport providers. This drive toward digital transformation is emerging as a characteristic marker of Australia's changing public transport environment.
Regional Connectivity and Equity in Transport Access
According to the Australia public transport systems market analysis, one of the key elements of market dynamics is the perpetual issue of providing equal access to regional and remote communities. While big cities have comprehensive and up-to-date transit systems, regional communities frequently have limited regular and dependable public transportation services. This inequality affects mobility, job opportunities, and access to basic services for people residing outside city centers. State and federal governments are increasingly aware of this gap and are spending on initiatives to enhance regional connectivity. Projects like regional rail improvement, long-distance coach services, and pilot services for on-demand buses are serving to increase transport availability in these underprivileged regions. In states like Victoria and New South Wales, community transport services play a key role in supporting mobility for elderly residents, people with disabilities, and low-income households. Addressing this urban-rural divide is vital for the long-term resilience and inclusivity of Australia’s public transport system, ensuring that market growth extends beyond metropolitan boundaries.
Opportunity of Australia Public Transport Systems Market:
Expansion of Integrated Multimodal Transport Networks
Perhaps the greatest potential in Australia's public transport systems market is building out and connecting multimodal networks. With cities growing more populous and suburban expansion increasing, the necessity for a unified transport system that combines trains, buses, light rail, ferries, and active transport modes in an effortless linkage is increasingly crucial. In Sydney and Melbourne, for instance, transport authorities are developing integrated ticketing systems and unified journey planning applications to enable passengers to make easy transfers between modes of service. This offers an expanding opportunity for digital infrastructure operators, smart mobility businesses, and logistics partners to take a greater role in developing user-friendly transport solutions. Additionally, opportunities exist to create "mobility hubs" near major transit stops that foster environmentally conscious urban development and lower car reliance. Improved last-mile connectivity and promotion of shared mobility solutions like bike-share and e-scooters can make the network more efficient and attractive overall.
Adoption of Low-Emission and Electric Transit Fleets
Australia's promise to cut carbon emissions and meet net-zero targets creates a significant growth opportunity for clean and sustainable public transport solutions. Transit authorities around the country are looking into or in the process of implementing low-emission options like electric buses and hydrogen vehicles to modernize old diesel fleets. Those countries such as New South Wales and the Australian Capital Territory have already embarked on long-term strategies to electrify their public bus fleet. This transition presents huge market opportunity for electric vehicle producers, charging station suppliers, and renewable energy operators. Moreover, local authorities will be encouraging the use of green technology through subsidies and procurement targets, speeding up industry change. For battery technology, smart grid, and vehicle-to-grid companies, the electrification of public transport presents a well-defined growth trajectory. These projects also support increasing public interest in green transport, providing a positive setting for financing and innovation in clean mobility products.
Digitalization and Mobility-as-a-Service (MaaS)
The expanding digitalization of transport services offers a robust chance for Australian Mobility-as-a-Service (MaaS) platform development. With commuters seeking personalized, efficient, and affordable means of getting around cities, there is a definite need for apps that consolidate public transit with ride-hailing, car-sharing, bike-sharing, and even walking paths into one interface. Australian cities, especially Brisbane and Adelaide, have already expressed interest in MaaS pilot schemes that provide users with real-time data, adaptable payment methods, and subscription-based travel packages. This developing transport model offers business prospects for transport data analysts, fintech organizations, and software developers. Governments are also encouraging schemes that enhance eases transport and minimize congestion, which results in policy drivers to support the implementation of MaaS systems. By leveraging data and technology, these platforms can optimize route planning, improve fare transparency, and deliver a more tailored transport experience, ushering in a new era for public transit in Australia.
Challenges of Australia Public Transport Systems Market:
Infrastructure Limitations and Aging Systems
One of the key challenges facing Australia’s public transport systems market is the presence of ageing infrastructure and limitations in existing networks. In much of the country, especially in older cities such as Sydney and Melbourne, legacy rail and tram networks are unable to keep up with growing numbers of passengers and new levels of service expectations. Delays, antiquated signaling, and maintenance problems remain major factors in eroding reliability and customer satisfaction. This necessitates vast investment, protracted planning horizons, and regularly generates short-term disruption that further undermines ridership. In addition, older infrastructure tends to be less easily compatible with the newest digital and green technologies, and integration becomes more complicated and expensive. Although new schemes like metro extensions and tunnel projects are being implemented, project completion times are lengthy, and budgets often surge over initial estimates. Such infrastructural issues slow the development pace of the market and restrict the scalability of new and innovative public transportation alternatives.
Discrepancies in Urban and Regional Service Access
One of the ongoing issues in the Australian public transport market is the wide disparity in the access to services between urban cities and regional or remote communities. While Sydney, Brisbane, and Perth have relative public transport network completeness, smaller towns and rural communities are plagued by limited or sporadic services. This regional divide impedes social justice, access to employment, and mobility for underprivileged groups such as Indigenous Australians and aging residents. For agricultural, tourism, or mining areas that are reliant on those industries, the absence of assured transport impedes economic engagement and community building. To extend services into these areas is physically and economically difficult by virtue of reduced population density and increased distances between points. While governments have launched regional transport schemes and pilot projects, maintaining long-term sustainability and a sufficient level of service coverage remains challenging. Redressing this imbalance is crucial to building an effectively inclusive and efficient national transport network, yet it remains a complicated and under-resourced component of the overall infrastructure agenda.
Funding Constraints and Policy Fragmentation
Another significant hurdle facing the Australian public transport systems market is the difficulty of achieving stable, long-term funding and coherent policymaking across various tiers of government. Public transport operations and infrastructure in Australia tend to depend on a combination of funding from federal, state, and local governments, resulting in uneven planning and incoherent priorities. Political leadership or policy direction changes can be slow down or sidetrack large-scale projects, leaving stakeholders and investors uncertain. Many large-scale projects also see cost overruns and funding deficiencies, straining state budgets and constraining new technology or service extension investments. Although public-private partnerships have promise, they are not always an option for all geographic areas or service categories. Policy misalignment across jurisdictions further complicates the work of developing integrated, multimodal systems that work effectively across borders. These financial and administrative barriers continue to test the long-term viability and strategic planning of Australia's public transport system.
Australia Public Transport Systems Market Segmentation:
IMARC Group provides an analysis of the key trends in each segment of the market, along with forecasts at the country level for 2026-2034. Our report has categorized the market based on mode of transport, and ownership.
Mode of Transport Insights:
- Rail Transport
- Urban Rail (Suburban/Commuter Rail)
- Metro Systems
- Light Rail/Trams
- Regional and Intercity Rail
- Bus Transport
- Urban and Suburban Buses
- Intercity and Regional Buses
- Ferry Transport
- Urban Ferries
- Regional Ferries
- On-Demand and Shared Mobility Services
- Ride-sharing and Carpooling
- Car Sharing
- Bike and Scooter Sharing
The report has provided a detailed breakup and analysis of the market based on the mode of transport. This includes rail transport (urban rail {suburban/commuter rail}, metro systems, light rail/trams, regional and intercity rail), bus transport (urban and suburban buses, intercity and regional buses), ferry transport (urban ferries, regional ferries), and on-demand and shared mobility services (ride-sharing and carpooling, car sharing, bike and scooter sharing).
Ownership Insights:
Access the comprehensive market breakdown Request Sample
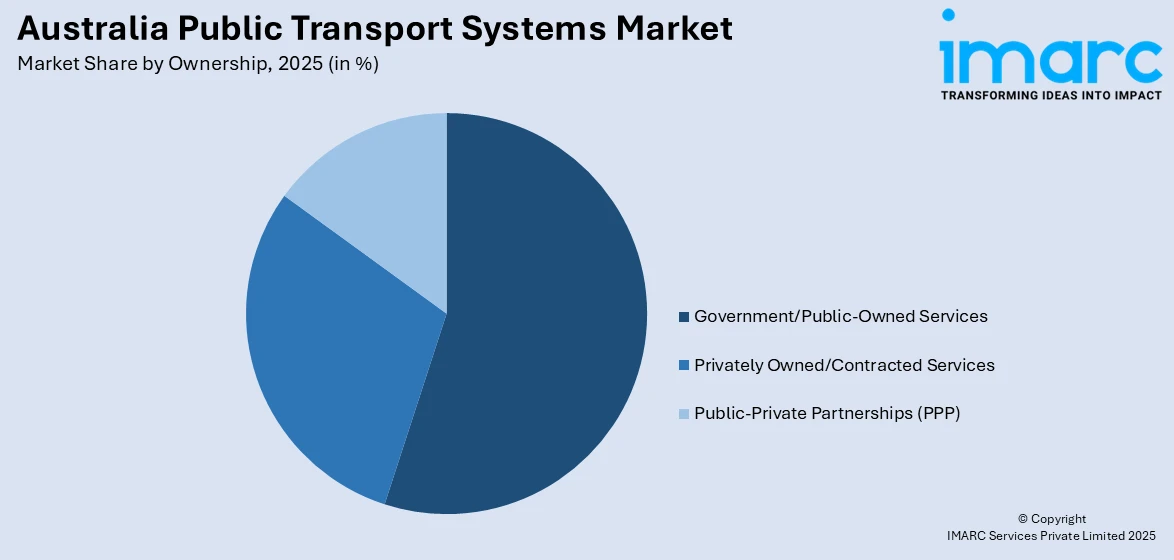
- Government/Public-Owned Services
- Privately Owned/Contracted Services
- Public-Private Partnerships (PPP)
A detailed breakup and analysis of the market based on the ownership have also been provided in the report. This includes government/public-owned services, privately owned/contracted services, and public-private partnerships (PPP).
Regional Insights:
- Australia Capital Territory & New South Wales
- Victoria & Tasmania
- Queensland
- Northern Territory & Southern Australia
- Western Australia
The report has also provided a comprehensive analysis of all the major regional markets, which include Australia Capital Territory & New South Wales, Victoria & Tasmania, Queensland, Northern Territory & Southern Australia, and Western Australia.
Competitive Landscape:
The market research report has also provided a comprehensive analysis of the competitive landscape. Competitive analysis such as market structure, key player positioning, top winning strategies, competitive dashboard, and company evaluation quadrant has been covered in the report. Also, detailed profiles of all major companies have been provided.
Australia Public Transport Systems Market News:
- May 2023: Conduent Transportation stated that the State of Victoria, Australia, has selected its subsidiary, a Conduent and Convergint partnership, to offer the next generation of the state's public transportation ticketing system, known as myki.
- September 2024: ComfortDelGro Corporation Limited announced that its Australian subsidiary, ComfortDelGro Corporation Australia Pty Ltd (CDC), through its subsidiary CDC Victoria Pty Ltd, was awarded three bus franchises as part of the Victorian Department of Transport and Planning's Metropolitan Zero Emission Bus (ZEB) Franchises tender, representing a 30% growth in its Victoria Public Bus business.
Australia Public Transport Systems Market Report Coverage:
| Report Features | Details |
|---|---|
| Base Year of the Analysis | 2025 |
| Historical Period | 2020-2025 |
| Forecast Period | 2026-2034 |
| Units | Billion USD |
| Scope of the Report | Exploration of Historical Trends and Market Outlook, Industry Catalysts and Challenges, Segment-Wise Historical and Future Market Assessment:
|
| Modes of Transport Covered | Rail Transport, Bus Transport, Ferry Transport, On-Demand and Shared Mobility Services |
| Ownerships Covered | Government/Public-Owned Services, Privately Owned/Contracted Services, Public-Private Partnerships (PPP) |
| Regions Covered | Australia Capital Territory & New South Wales, Victoria & Tasmania, Queensland, Northern Territory & Southern Australia, Western Australia |
| Customization Scope | 10% Free Customization |
| Post-Sale Analyst Support | 10-12 Weeks |
| Delivery Format | PDF and Excel through Email (We can also provide the editable version of the report in PPT/Word format on special request) |
Key Benefits for Stakeholders:
- IMARC’s industry report offers a comprehensive quantitative analysis of various market segments, historical and current market trends, market forecasts, and dynamics of the Australia public transport systems market from 2020-2034.
- The research report provides the latest information on the market drivers, challenges, and opportunities in the Australia public transport systems market.
- Porter's five forces analysis assist stakeholders in assessing the impact of new entrants, competitive rivalry, supplier power, buyer power, and the threat of substitution. It helps stakeholders to analyze the level of competition within the Australia public transport systems industry and its attractiveness.
- Competitive landscape allows stakeholders to understand their competitive environment and provides an insight into the current positions of key players in the market.
Key Questions Answered in This Report
The Australia public transport systems market was valued at USD 4.2 Billion in 2025.
The Australia public transport systems market is projected to exhibit a CAGR of 4.33% during 2026-2034.
The Australia public transport systems market is expected to reach a value of USD 6.2 Billion by 2034.
The Australia public transport systems market trends include developing Mobility-as-a-Service (MaaS) platforms, integrating smart mobility solutions, and increasing the use of electric and low-emission automobiles. There is also a strong focus on multimodal connectivity, digital ticketing, and improving access in regional areas to create more inclusive and efficient transport networks.
The Australia public transport systems market is driven by rapid urbanization, population growth in major cities, and increasing demand for sustainable mobility. Government infrastructure investments, technological advancements, and a national push toward reducing carbon emissions are also key drivers supporting the expansion and modernization of public transport across urban and regional areas.
Need more help?
- Speak to our experienced analysts for insights on the current market scenarios.
- Include additional segments and countries to customize the report as per your requirement.
- Gain an unparalleled competitive advantage in your domain by understanding how to utilize the report and positively impacting your operations and revenue.
- For further assistance, please connect with our analysts.
 Request Customization
 Speak to an Analyst
 Request Brochure
 Inquire Before Buying
Benefits of Customization
- Personalize this research
- Triangulate with your data
- Get data as per your format and definition
- Gain a deeper dive into a specific application, geography, customer, or competitor
- Any level of personalization
Get in Touch With Us
UNITED STATES
Phone: +1-201-971-6302
INDIA
Phone: +91-120-433-0800
UNITED KINGDOM
Phone: +44-753-714-6104
Email: sales@imarcgroup.com
Client Testimonials


.webp)


