
Australia Power Market Size, Share, Trends and Forecast by Generation Source, and Region, 2026-2034
Australia Power Market Size and Share:
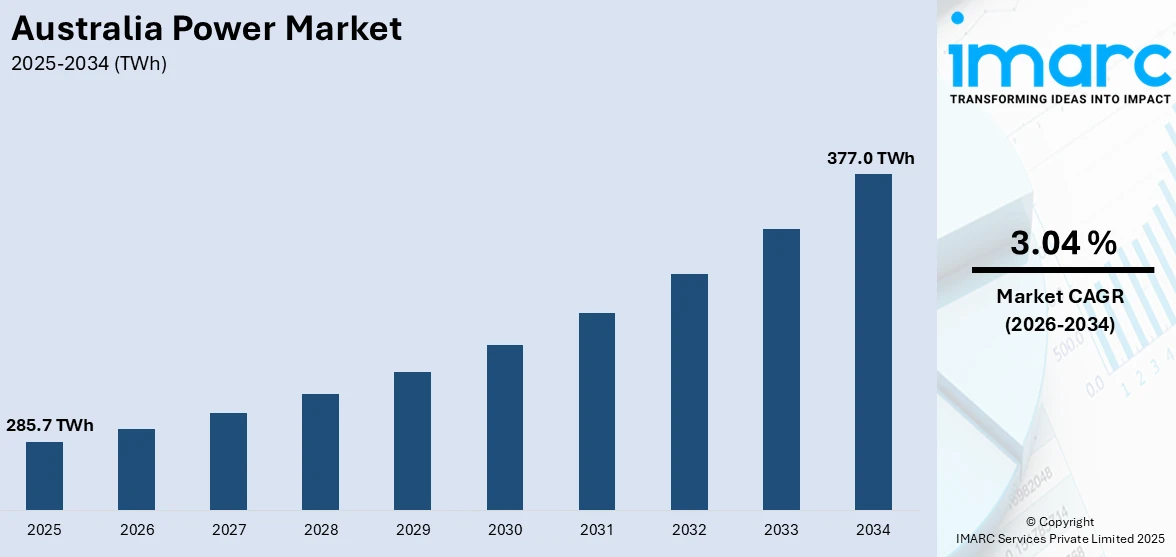
The Australia power market size reached 285.7 TWh in 2025. Looking forward, the market is expected to reach 377.0 TWh by 2034, exhibiting a growth rate (CAGR) of 3.04% during 2026-2034. The Australia power market is driven by increasing renewable energy adoption, rising electricity demand, government incentives for clean energy, grid modernization, battery storage expansion, volatile wholesale electricity prices, phase-out of coal plants, corporate sustainability goals, virtual power plant integration, and investments in hydrogen and other emerging energy technologies.
|
Report Attribute
|
Key Statistics
|
|---|---|
|
Base Year
|
2025
|
|
Forecast Years
|
2026-2034
|
|
Historical Years
|
2020-2025
|
| Market Size in 2025 | 285.7 TWh |
| Market Forecast in 2034 | 377.0 TWh |
| Market Growth Rate (2026-2034) | 3.04% |
Key Trends of Australia Power Market:
Transition to Renewable Energy Sources
Australia's efforts to curb greenhouse gas emissions have resulted in a significant turn towards renewable energy. Renewable sources of energy such as solar, wind, and hydroelectricity contributed around 35% of the country's electricity output as of 2023. The move is motivated by environmental objectives as well as the declining cost of renewable technology. For example, the Australian Energy Statistics reported that renewable energy sources have accounted for an estimated 95,963 GWh, representing 35% of Australia's total electricity output in 2023. The Australian Renewable Energy Agency (ARENA) has been instrumental in supporting this shift, funding numerous projects aimed at integrating renewables into the electricity system. These efforts encompass extensive solar power plants, energy storage systems, and projects focused on producing green hydrogen. For instance, ARENA has pledged to numerous projects, with investments amounting to billions of dollars, to promote the use of renewable energy technologies more rapidly. Furthermore, the Australian Energy Market Operator (AEMO) identified the requirement of significant investment in grid assets to ensure the variability in renewable sources.
To get more information on this market Request Sample
Changing Regulatory Landscape
The regulatory framework has a considerable influence contributing to the growth of the Australia power market share. New policy changes, as proposed by the Australian government to reach net-zero emissions by 2050, have affected energy consumption and production trends. The State of the Energy Market report of the Australian Energy Regulator identified that high inflation and increasing network investment expenses might add to the imminent issues of high energy prices. The Australian Energy Market Operator (AEMO) has also been at the forefront of implementing efforts to drive grid reliability and security. This involves the addition of renewable energy sources and the formation of energy storage solutions. Nevertheless, the AER cautioned that high inflation and increased network investment expenditure may exacerbate the near-term issues of inflating energy prices. Moreover, the shift to cleaner energy sources and the changing regulatory environment are decisive drivers of the Australian power market.
Growth Drivers of Australia Power Market:
Renewable Energy Transition and Climate Pledges
Among the main growth drivers of Australia's power market is its speeding up transition toward renewable energy, fueled by both climate goals and Australia's abundant natural resources. Australia is well-placed with high solar irradiance and wide wind corridors, and especially in places such as South Australia, western Victoria, and some parts of Queensland. These natural benefits render renewable generation economically viable and technically viable. In reply to international climate commitments and national net-zero ambitions, the federal and state governments have made large investments in large-scale solar farms, wind farms, and energy storage technologies like pumped hydro and batteries. Nationally important projects leading this transition include the Snowy Hydro upgrade and Queensland's SuperGrid. This renewable energy momentum is not only displacing old coal facilities but also building a new, distributed grid system. The need for smart grid technology and flexible power generation is anticipated to continue growing for the entire power value chain.
Grid Modernization and Energy Infrastructure Investment
Australia's old electricity grid is being fundamentally transformed to address the needs of an evolving generation mix and increasingly decentralized energy generation. One of the most compelling drivers of growth in this sector is the demand for upgrading infrastructure and interconnection between state boundaries to maintain a reliable supply of energy. Efforts such as the EnergyConnect interconnector from New South Wales to South Australia showcase the drive by the government to make the grid more resilient and facilitate the easier incorporation of renewable power sources. These infrastructure developments are especially important in remote locations like Western Australia's Pilbara region, where big mining operations have been depending on stable power supply and now are increasingly using renewables to lower costs and emissions. Private sector participation is also being facilitated by government incentives, planning reforms, and regulatory reforms. While demand for energy increases and becomes increasingly sophisticated, the demand for enhanced transmission, digital monitoring, and real-time energy management systems continues to drive growth along with Australia power market demand.
Decentralization, Electrification, and Consumer Participation
One of the emerging trends in Australia's electricity market is the decentralization of power generation, with households and businesses becoming engaged participants through rooftop solar, battery storage, and electric vehicles. This change is revolutionizing the conventional utility-consumer dynamic and building new market forces. Australia is the world's top per-capita rooftop solar penetration, especially across suburban areas of Queensland and Western Australia, where maximum exposure to sunlight and energy autonomy are powerful drivers. Combined with incentives at the state level and feed-in tariffs, this decentralization minimizes dependence on central power and stimulates investment in area energy systems. Electrification of transport and heating sectors is also fueling demand growth, especially for urban centers in accelerated development. Consumers are now increasingly being driven by environmental considerations and long-term cost benefits, leading to increased adoption of energy-efficient appliances and home automation technologies. These changes in behavior and technology are transforming the energy market in Australia and making consumer-driven growth a mainstay of power market evolution.
Opportunities of Australia Power Market:
Expansion of Renewable Energy and Export Opportunities
Australia's electricity market offers great opportunities through the further development of renewable energy production and new potential for energy exports. With its vast open spaces and rich solar and wind resources, Australia has the natural opportunity to become the world leader in the production of renewable electricity. Places such as the Northern Territory and South Australia are witnessing growing investments in wind and solar farms, fueled by supportive geography and governmental encouragement. Exporting renewable energy in new modes, like green hydrogen and ammonia, to power-hungry countries in Asia remains one of the most exciting opportunities. Initiatives such as the planned Sun Cable project, which seeks to send solar power produced in the Northern Territory to Singapore through undersea cables, are prime examples of this vision. Not only are these innovations technologically revolutionary, but they also set Australia up to be a prospective clean energy exporter. This new development might reshape the nation's long-held position in world energy markets from fossil fuels to clean power exports.
Battery Storage and Grid Stability Solutions
According to the Australia power market analysis, with increasing penetration of renewables, there is a need for energy storage and grid stability creating an expanding series of opportunities for the region. Battery storage systems are becoming vital in balancing supply and demand, particularly with the intermittency of solar and wind energy. There are investments in utility-scale battery deployments in states such as Victoria and New South Wales, usually near renewable energy zones or large urban centers. These installations not only support peak-time backup but also facilitate increased penetration of renewables into the network. Moreover, adoption of smaller-scale batteries in commercial and residential applications is growing very quickly, especially in regions with high rooftop solar penetration. Virtual power plants, where aggregated distributed batteries are connected to act as one energy source, are another cutting-edge solution being tested in South Australia and other locations. This drive towards energy services creates opportunities for investors, producers, and technology companies to help shape a more flexible, resilient power system.
Electrification and Digital Energy Services
The growing electrification of Australian households, transport, and industry creates diverse opportunities for energy service companies, as well as technology companies. As electric cars become increasingly prevalent, especially in forward-thinking urban areas such as Melbourne and Canberra, the need for EV charging networks and smart energy management is on the rise. This growth comes with increased home electrification, where more Australians are turning away from gas-based systems towards electric for heating, cooking, and water systems. These changes require upgrades in domestic and commercial power capacity, with opportunities in grid upgrade, demand management, and digital energy monitoring solutions. Furthermore, there is growing interest in energy-as-a-service concepts, where consumers sign up to energy systems that are packaged with solar, storage, and software components. This business model is becoming increasingly popular in areas where grid reliability is poor or in which consumers want more control over their energy consumption. Together, digitalization and electrification are transforming the customer experience and creating new avenues of growth in Australia's electricity market.
Government Support of Australia Power Market:
Renewable Energy Zones and Strategic Investment
Government assistance has a pivotal function in determining the way forward for Australia's electricity market, especially in the form of setting up Renewable Energy Zones (REZs). REZs are specifically designated regions defined by state governments to accommodate clustered renewable energy development, comprising wind, solar, and battery storage initiatives. New South Wales, for instance, is actively deploying several REZs as part of its longer-term electricity plan, which has the aim of substituting worn-out coal-fired generation with clean sources. Such zones are facilitated by well-coordinated transmission planning, simplified permit regimes, and state financing to secure private investment. Governments want to maximize efficiency and minimize the social and environmental footprint by concentrating on geographically favorable points for renewable energy. This forward-looking strategy is first in the region and embodies a systematic way of enabling large-scale energy transformation. REZs give developers a clearer investment track while enabling grid infrastructure to keep up with swift developments in energy production.
Energy Storage and Grid Modernization Support
Australian federal and state governments increasingly are acknowledging the value of energy storage and grid stability in dealing with the problems created by an increasingly distributed and renewable-dominant power system. Such support is provided through financial incentives, regulatory change, and explicit investment in big battery schemes and transmission upgrades. Victoria, for instance, is allocating resources to battery storage networks that are intended to stabilize the grid and offer peak-time support. Along the same lines, the federal government is supporting the extension of interconnectors across states to enable more elastic power flows and diminish regional supply threats. Initiatives such as the Capacity Investment Scheme seek to provide revenue certainty to dispatchable clean energy projects, which will attract new market participants. These initiatives show an awareness that energy transformation is not merely a case of generation, but also of having infrastructure able to accommodate it. By investing in flexible, advanced systems, Australia is building a more adaptable and resilient electricity market.
Consumer Incentives and Decentralized Energy Support
A second key area of government assistance in the Australian electricity market is on the side of consumers and decentralization. Governments have rolled out rebates, subsidies, and financing schemes to encourage households and businesses to invest in rooftop solar, batteries, and energy efficiency improvements. These initiatives are most evident in a state such as Queensland and South Australia, where solar penetration has been promoted through grants for equipment and feed-in tariffs. Besides reducing the cost of energy to consumers, these efforts are assisting in levelling peak demand curves and lessening dependency on centralized fossil fuel-based generation. Virtual power plant programs, under which individual residential batteries are grouped to act as one grid asset, are also being government-supported. The policies are opening new value streams for customers and enabling them to contribute positively to the power market. Australia's decentralized energy support policy is empowering customers and strengthening the nation's larger push toward a cleaner, smarter energy future.
Challenges of Australia Power Market:
Reliability of the Grid and Renewable Integration
One of the concerns facing Australia's electricity market is maintaining grid reliability in the face of increasing penetration of intermittent renewable energy. Although solar and wind generation are critical to Australia's transition to clean energy, their intermittency imposes stress on the current grid infrastructure, especially in areas such as South Australia and western New South Wales. These regions tend to have a high level of renewable generation but insufficient transmission capability to shift power efficiently to areas of demand. Congestion and bottlenecks on the grid can result in curtailment of renewable energy, compromising both system security and investor confidence. Additionally, the decentralized nature of renewable installations, like rooftop solar, complicates real-time balancing of energy. The national grid as it exists today was constructed to accommodate big, centralized power stations—not widespread, weather-driven generation. Reinforcing transmission lines, adding large-scale storage, and deploying smart grid technologies are all options but expensive ones, and federal and state coordination can further stall advancements.
Regulatory Complexity and Market Fragmentation
Australia's electricity market is made complex by its federal system, which shares responsibilities between the national government, state governments, and independent regulators. This fragmentation frequently results in inconsistent energy planning strategies and policies between states, which in turn can stifle coordinated investment and long-term infrastructure investment. For example, whereas certain states such as Victoria and South Australia pursue renewable targets and invests in grid innovation aggressively, others might choose to adopt more gradual or conservative strategies. Such mismatches leave developers and investors that operate in multiple jurisdictions in a state of uncertainty. Also, the intricately regulated environment—ranging from approval procedures, environmental regulation, and energy market rules—may become an entry impediment for new players or new technologies. The National Electricity Market (NEM), which interconnects the eastern states, has also been criticized for lagging behind the fast pace of energy transformation. Simplifying regulation and aligning state and federal energy policy continue to pose major challenges in developing a more unified and responsive power market.
Energy Affordability and Equity
Energy affordability and equity issues continue to be a challenge in Australia's energy market despite technological advances in renewable energy and innovation. Most low-income communities, especially those in remote and regional regions like Northern Queensland or rural Western Australia, continue to experience high electricity bills and restricted access to energy-efficient technology. Whereas rooftop solar and competitive energy retailers are available to urban dwellers, others less able to gain access include renters, apartment owners, or those without the financial capacity to invest in energy improvements. Off-grid communities and indigenous peoples have even higher barriers, with many depending on expensive diesel generators or receiving sporadic supply. Policy initiatives to modernize the grid and promote cleaner energy must be weighed against initiatives that secure affordability and access. Without special help, the fruits of the energy transition could be left behind for some. Energy poverty must be addressed and universal access to new energy solutions ensured to ensure ongoing support from the public for Australia's changing power system.
Australia Power Market Segmentation:
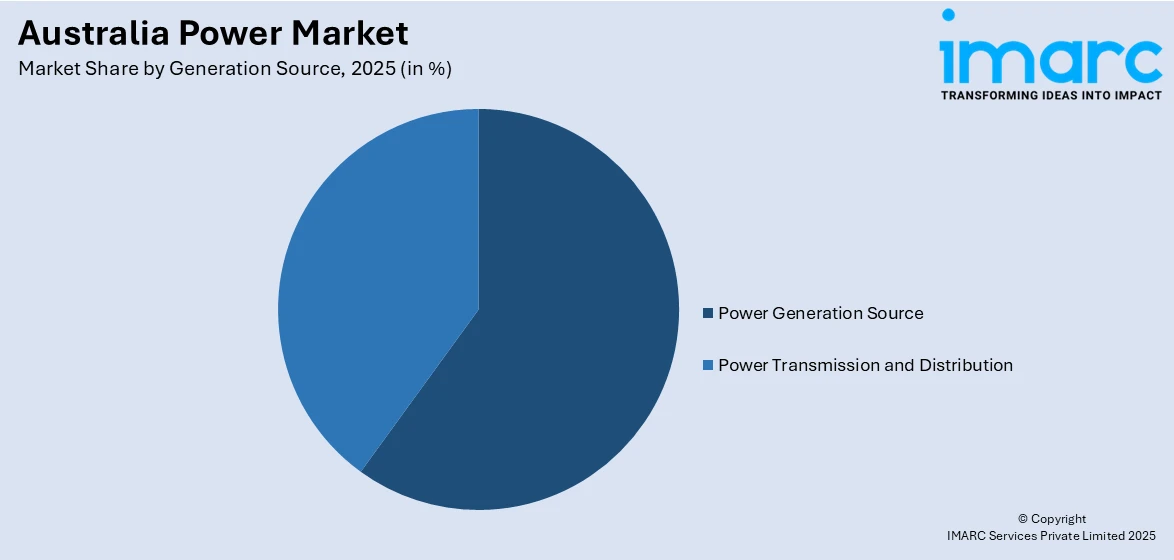
IMARC Group provides an analysis of the key trends in each segment of the market, along with forecasts at the region/country level for 2026-2034. Our report has categorized the market based on generation source.
Generation Source Insights:
Access the comprehensive market breakdown Request Sample
- Power Generation Source
- Coal
- Natural Gas
- Oil
- Renewables
- Others
- Power Transmission and Distribution
The report has provided a detailed breakup and analysis of the market based on the generation source. This includes power generation source (coal, natural gas, oil, renewables, and others) and power transmission and distribution.
Regional Insights:
- Australia Capital Territory & New South Wales
- Victoria & Tasmania
- Queensland
- Northern Territory & Southern Australia
- Western Australia
The report has also provided a comprehensive analysis of all the major regional markets, which include Australia Capital Territory & New South Wales, Victoria & Tasmania, Queensland, Northern Territory & Southern Australia, and Western Australia.
Competitive Landscape:
The market research report has also provided a comprehensive analysis of the competitive landscape. Competitive analysis such as market structure, key player positioning, top winning strategies, competitive dashboard, and company evaluation quadrant has been covered in the report. Also, detailed profiles of all major companies have been provided.
Australia Power Market News:
- January 2025: The Australian Energy Market Commission (AEMC) has reached a final decision that will enable virtual power plants (VPPs), commercial and industrial demand response, and consolidated batteries to directly compete with conventional power stations in Australia’s energy market starting in May 2027.
- December 2024: The Energy Market Commission in Australia approved an accelerated smart meter rollout to be completed by 2030, aiming to bring about cost savings for customers and support a data-enabled energy system. The new rule includes customer safeguards such as prohibiting upfront costs before smart meter installation, requiring explicit informed consent for tariff changes, and improving customer understanding of their electricity usage.
Australia Power Market Report Coverage:
| Report Features | Details |
|---|---|
| Base Year of the Analysis | 2025 |
| Historical Period | 2020-2025 |
| Forecast Period | 2026-2034 |
| Units | TWh |
| Scope of the Report |
Exploration of Historical Trends and Market Outlook, Industry Catalysts and Challenges, Segment-Wise Historical and Future Market Assessment:
|
| Generation Sources Covered | Power Generation Source (Coal, Natural Gas, Oil, Renewables, Others), Power Transmission and Distribution |
| Regions Covered | Australia Capital Territory & New South Wales, Victoria & Tasmania, Queensland, Northern Territory & Southern Australia, Western Australia |
| Customization Scope | 10% Free Customization |
| Post-Sale Analyst Support | 10-12 Weeks |
| Delivery Format | PDF and Excel through Email (We can also provide the editable version of the report in PPT/Word format on special request) |
Key Benefits for Stakeholders:
- IMARC’s industry report offers a comprehensive quantitative analysis of various market segments, historical and current market trends, market forecasts, and dynamics of the Australia power market from 2020-2034.
- The research report provides the latest information on the market drivers, challenges, and opportunities in the Australia power market.
- Porter's five forces analysis assist stakeholders in assessing the impact of new entrants, competitive rivalry, supplier power, buyer power, and the threat of substitution. It helps stakeholders to analyze the level of competition within the Australia power industry and its attractiveness.
- Competitive landscape allows stakeholders to understand their competitive environment and provides an insight into the current positions of key players in the market.
Key Questions Answered in This Report
The Australia power market was valued at 285.7 TWh in 2025.
The Australia power market is projected to exhibit a CAGR of 3.04% during 2026-2034.
The Australia power market is expected to reach a value of 377.0 TWh by 2034.
Trends in the power market in Australia are high-speed growth in renewable energy, growing battery storage capacity, and greater consumer engagement through rooftop solar and virtual power plants. Decentralization, grid modernization, and the electrification of transport and dwellings are transforming the energy market, while government incentives promote clean energy zones and massive infrastructure redesign.
Australia's power market is fueled by its rich renewable resources, government-supported energy transition strategy, increased consumer uptake of rooftop solar, and increasing electrification across industries. Upgrading infrastructure, battery storage, and smart grid technologies complement growth further, with export ambitions in green hydrogen opening fresh international market opportunities specific to the region.
Need more help?
- Speak to our experienced analysts for insights on the current market scenarios.
- Include additional segments and countries to customize the report as per your requirement.
- Gain an unparalleled competitive advantage in your domain by understanding how to utilize the report and positively impacting your operations and revenue.
- For further assistance, please connect with our analysts.
 Request Customization
 Speak to an Analyst
 Request Brochure
 Inquire Before Buying
Benefits of Customization
- Personalize this research
- Triangulate with your data
- Get data as per your format and definition
- Gain a deeper dive into a specific application, geography, customer, or competitor
- Any level of personalization
Get in Touch With Us
UNITED STATES
Phone: +1-201-971-6302
INDIA
Phone: +91-120-433-0800
UNITED KINGDOM
Phone: +44-753-714-6104
Email: sales@imarcgroup.com
Client Testimonials


.webp)


