
Australia Maritime Shipping Market Report by Cargo Type (Dry Bulk Cargo, Liquid Bulk Cargo, Containerized Cargo, and Others), Vessel Type (Container Ships, Bulk Carriers, Oil Tankers, LNG Carriers, and Others), Service Type (Liner Shipping, Tramp Shipping, Chartering Services, Freight Forwarding, and Others), End-Use Industry (Manufacturing, Energy, Agriculture and Food Products, Construction, Retail and Consumer Goods, and Others), and Region 2025-2033
Australia Maritime Shipping Market Overview:
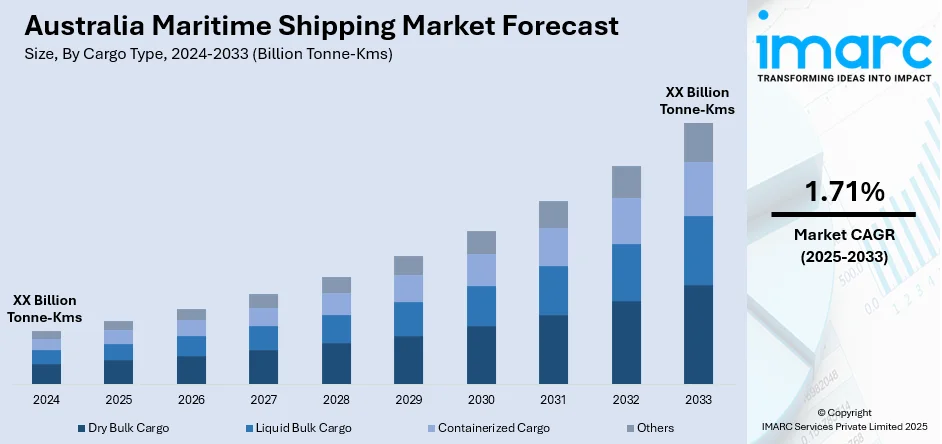
The Australia maritime shipping market size is projected to exhibit a growth rate (CAGR) of 1.71% during 2025-2033. The strong trade relationships with Asia Pacific countries, growing import and export activities, rising infrastructure developments in ports, significant advancements in shipping technology, regulatory changes for environmental sustainability, and the increased demand for bulk commodities and consumer goods are some of the major factors propelling the growth of the market.
|
Report Attribute
|
Key Statistics
|
|---|---|
|
Base Year
|
2024
|
|
Forecast Years
|
2025-2033
|
|
Historical Years
|
2019-2024
|
| Market Growth Rate 2025-2033 | 1.71% |
Australia Maritime Shipping Market Trends:
Strong Trade Relationships
Australia's extensive trade connections with Asia-Pacific countries, particularly for exporting commodities like coal, iron ore, and natural gas, primarily drive maritime shipping demand. For instance, Ports Australia’s inaugural State of Trade report, published in September 2024, highlights the crucial economic role of Australian ports, supporting nearly 700,000 jobs and contributing $264 billion to the economy. The report further mentions that Australian ports handle 99% of the nation’s international trade by volume, managing $650 billion worth of trade annually. Iron Ore is the largest export by volume, representing 36% of total exports, far surpassing Coal (14%) and Agriculture and Food (13%). Australian ports see 31,000 vessels each year, moving 1.6 billion tonnes of trade and 1.25 million cruise passengers. The report highlights that Australian ports handle 99% of the nation’s international trade by volume, managing $650 billion worth of trade annually. Iron Ore is the largest export by volume, representing 36% of total exports, far surpassing Coal (14%) and Agriculture and Food (13%). These extensive trade activities reflect the strong trade relationships of the country across the globe, which, in turn, contribute to the market growth.
To get more information on this market, Request Sample
Rising Infrastructure Developments
Investments in port infrastructure and improvements in logistics and shipping technology enhance efficiency and capacity, supporting increased shipping activities and growth in the sector. For instance, in May 2024, Western Australia announced its plans to invest $246 million from its 2024-2025 budget to improve port infrastructure. A new $500 million Key Industries Fund will develop land for industrial use and support infrastructure in 13 strategic industrial areas (SIAs) for mineral processing and green hydrogen production. This fund complements the industrial leasing incentive program introduced in late 2023. A $200 million allocation is designated for a new Critical Minerals Advanced Processing Common User Facility, contingent on Commonwealth shared financing. $324 million is earmarked for energy transition efforts, focusing on long-term planning and transmission infrastructure purchases. An additional $148 million will enhance common-use power network infrastructure in the North West Interconnected System. A $373 million investment in ports includes upgrades to Fremantle, Kwinana, and Esperance ports, construction of a new freight wharf in Dampier, and roadworks at Utah Point in Port Hedland.
Australia Maritime Shipping Market News:
- In March 2024, Australia and Singapore agreed to formally collaborate on establishing a green and digital shipping corridor between the two countries. Federal transport ministries of both the countries signed the memorandum of understanding (MoU) on 5 March during the ninth Australia-Singapore Annual Leaders’ Meeting. Under the MOU, the countries plan to explore opportunities to develop zero or near-zero GHG emission fuel supply chains for the maritime industry.
- In March 2023, The Australian Government announced the development of a Maritime Emissions Reduction National Action Plan (MERNAP) to map out a workable green transition for the maritime industry. MERNAP will strengthen Australia’s own strategic direction on a seamless energy transition for its domestic maritime sector, while also cooperating with other countries on low and zero-emissions marine operations.
Australia Maritime Shipping Market Segmentation:
IMARC Group provides an analysis of the key trends in each segment of the market, along with forecasts at the country level for 2025-2033. Our report has categorized the market based on cargo type, vessel type, service type, and end-use industry.
Cargo Type Insights:
- Dry Bulk Cargo
- Liquid Bulk Cargo
- Containerized Cargo
- Others
The report has provided a detailed breakup and analysis of the market based on the cargo type. This includes dry bulk cargo, liquid bulk cargo, containerized cargo, and others.
Vessel Type Insights:
- Container Ships
- Bulk Carriers
- Oil Tankers
- LNG Carriers
- Others
A detailed breakup and analysis of the market based on the vessel type have also been provided in the report. This includes container ships, bulk carriers, oil tankers, LNG carriers, and others.
Service Type Insights:
- Liner Shipping
- Tramp Shipping
- Chartering Services
- Freight Forwarding
- Others
The report has provided a detailed breakup and analysis of the market based on the service type. This includes liner shipping, tramp shipping, chartering services, freight forwarding, and others.
End-Use Industry Insights:
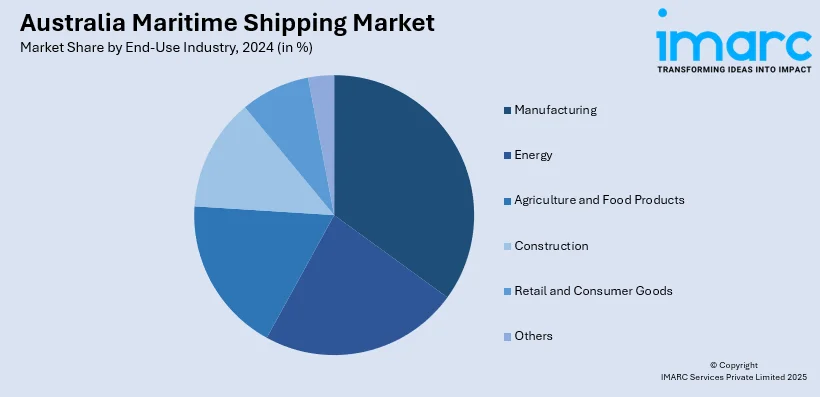
- Manufacturing
- Energy
- Agriculture and Food Products
- Construction
- Retail and Consumer Goods
- Others
A detailed breakup and analysis of the market based on the end-use industry have also been provided in the report. This includes manufacturing, energy, agriculture and food products, construction, retail and consumer goods, and others.
Regional Insights:
- Australia Capital Territory & New South Wales
- Victoria & Tasmania
- Queensland
- Northern Territory & Southern Australia
- Western Australia
The report has also provided a comprehensive analysis of all the major regional markets, which include Australia Capital Territory & New South Wales, Victoria & Tasmania, Queensland, Northern Territory & Southern Australia, and Western Australia.
Competitive Landscape:
The market research report has also provided a comprehensive analysis of the competitive landscape. Competitive analysis such as market structure, key player positioning, top winning strategies, competitive dashboard, and company evaluation quadrant has been covered in the report. Also, detailed profiles of all major companies have been provided.
Australia Maritime Shipping Market Report Coverage:
| Report Features | Details |
|---|---|
| Base Year of the Analysis | 2024 |
| Historical Period | 2019-2024 |
| Forecast Period | 2025-2033 |
| Units | Billion Tonne-Kms |
| Scope of the Report | Exploration of Historical Trends and Market Outlook, Industry Catalysts and Challenges, Segment-Wise Historical and Future Market Assessment:
|
| Cargo Types Covered | Dry Bulk Cargo, Liquid Bulk Cargo, Containerized Cargo, Others |
| Vessel Types Covered | Container Ships, Bulk Carriers, Oil Tankers, LNG Carriers, Others |
| Service Types Covered | Liner Shipping, Tramp Shipping, Chartering Services, Freight Forwarding, Others |
| End-Use Industries Covered | Manufacturing, Energy, Agriculture and Food Products, Construction, Retail and Consumer Goods, Others |
| Regions Covered | Australia Capital Territory & New South Wales, Victoria & Tasmania, Queensland, Northern Territory & Southern Australia, Western Australia |
| Customization Scope | 10% Free Customization |
| Post-Sale Analyst Support | 10-12 Weeks |
| Delivery Format | PDF and Excel through Email (We can also provide the editable version of the report in PPT/Word format on special request) |
Key Questions Answered in This Report:
- How has the Australia maritime shipping market performed so far and how will it perform in the coming years?
- What has been the impact of COVID-19 on the Australia maritime shipping market?
- What is the breakup of the Australia maritime shipping market on the basis of cargo type?
- What is the breakup of the Australia maritime shipping market on the basis of vessel type?
- What is the breakup of the Australia maritime shipping market on the basis of service type?
- What is the breakup of the Australia maritime shipping market on the basis of end-use industry?
- What are the various stages in the value chain of the Australia maritime shipping market?
- What are the key driving factors and challenges in the Australia maritime shipping?
- What is the structure of the Australia maritime shipping market and who are the key players?
- What is the degree of competition in the Australia maritime shipping market?
Key Benefits for Stakeholders:
- IMARC’s industry report offers a comprehensive quantitative analysis of various market segments, historical and current market trends, market forecasts, and dynamics of the Australia maritime shipping market from 2019-2033.
- The research report provides the latest information on the market drivers, challenges, and opportunities in the Australia maritime shipping market.
- Porter's five forces analysis assist stakeholders in assessing the impact of new entrants, competitive rivalry, supplier power, buyer power, and the threat of substitution. It helps stakeholders to analyze the level of competition within the Australia maritime shipping industry and its attractiveness.
- Competitive landscape allows stakeholders to understand their competitive environment and provides an insight into the current positions of key players in the market.
Need more help?
- Speak to our experienced analysts for insights on the current market scenarios.
- Include additional segments and countries to customize the report as per your requirement.
- Gain an unparalleled competitive advantage in your domain by understanding how to utilize the report and positively impacting your operations and revenue.
- For further assistance, please connect with our analysts.
 Request Customization
 Speak to an Analyst
 Request Brochure
 Inquire Before Buying
Benefits of Customization
- Personalize this research
- Triangulate with your data
- Get data as per your format and definition
- Gain a deeper dive into a specific application, geography, customer, or competitor
- Any level of personalization
Get in Touch With Us
UNITED STATES
Phone: +1-201-971-6302
INDIA
Phone: +91-120-433-0800
UNITED KINGDOM
Phone: +44-753-714-6104
Email: sales@imarcgroup.com
Client Testimonials


.webp)


