
Australia Intellectual Property Management Market Size, Share, Trends and Forecast by Component, Deployment Mode, Application, End User, and Region, 2026-2034
Australia Intellectual Property Management Market Summary:
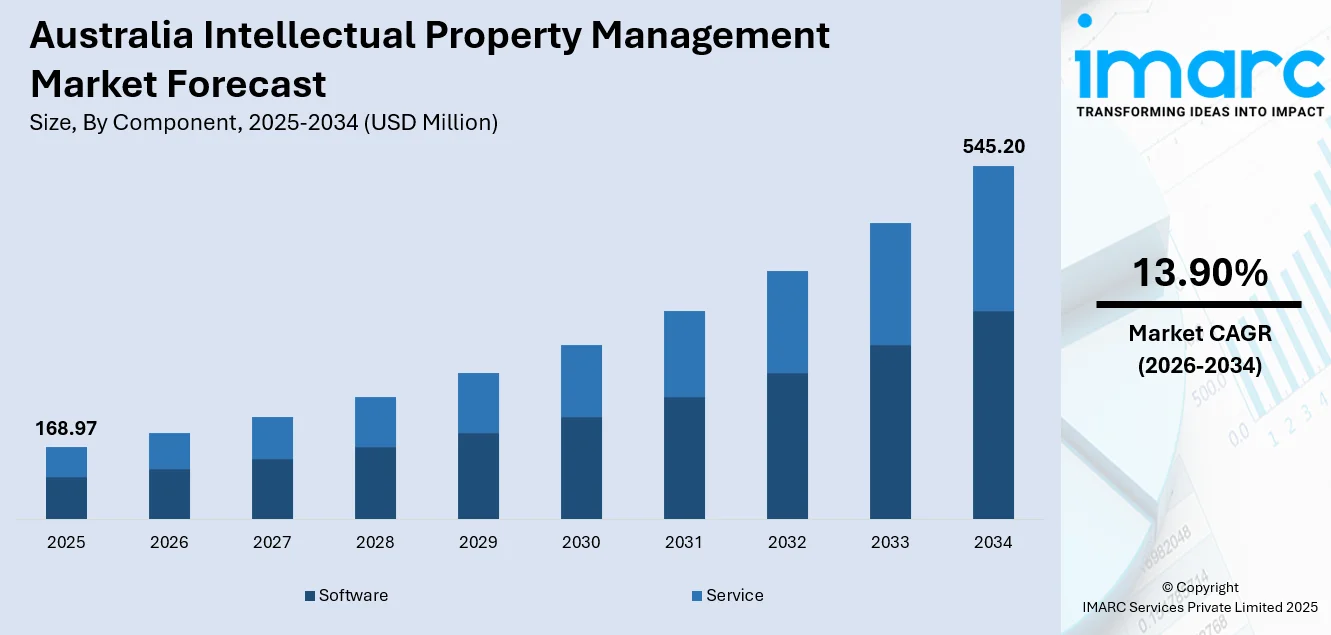
The Australia intellectual property management market size was valued at USD 168.97 Million in 2025 and is projected to reach USD 545.20 Million by 2034, growing at a compound annual growth rate of 13.90% from 2026-2034.
Australia's IP management ecosystem is experiencing robust growth as digital transformation accelerates across sectors, with enterprises leveraging advanced IP software platforms to streamline patent prosecution, trademark monitoring, and licensing administration while strengthening competitive positioning through strategic IP portfolio optimization. The market is driven by government initiatives promoting IP system modernization through regulatory reforms, rising patent and trademark filing activity reflecting sustained innovation across technology and biotechnology verticals, and growing international collaboration generating complex cross-border licensing arrangements that demand sophisticated IP management infrastructure, thereby expanding the Australia intellectual property management market share.
Key Takeaways and Insights:
- By Component: Service dominates the market with a share of 56% in 2025, driven by enterprises' increasing reliance on specialized IP consulting for portfolio strategy, freedom-to-operate analyses, and complex multi-jurisdictional licensing negotiations requiring deep expertise.
- By Deployment Mode: Cloud leads the market with a share of 61% in 2025, mirroring extensive business transitions to flexible SaaS platforms that facilitate remote teamwork, immediate portfolio visibility, and smooth integration with enterprise resource planning systems.
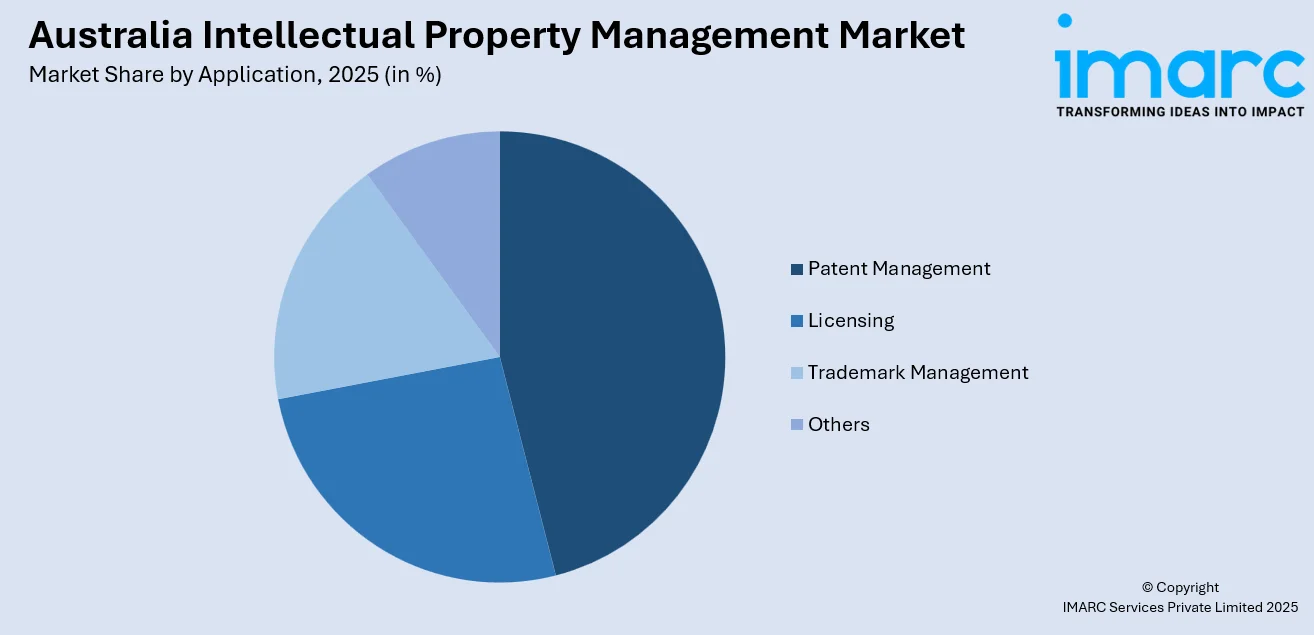
- By Application: Patent management represents the largest segment with a market share of 33% in 2025, since companies prioritize automated renewal tracking, systematic patent prosecution workflows, and comprehensive prior art analysis capabilities to protect technical innovations.
- By End User: IT and telecom exhibit a clear dominance with 20% share in 2025, as technology companies leverage extensive patent portfolios for competitive positioning, telecommunications firms manage standard essential patents for industry-wide licensing, and software enterprises protect algorithms and user interface innovations.
- By Region: Australia Capital Territory & New South Wales leads the market with a share of 25% in 2025, concentrated around government institutions in Canberra and corporate technology hubs in Sydney requiring sophisticated IP infrastructure for regulatory compliance and commercial operations.
- Key Players: The Australia intellectual property management market demonstrates moderate competitive intensity, with specialized IP software vendors competing alongside global enterprise legal technology providers and boutique consulting firms across enterprise and small-to-medium business segments, alongside emerging Australian startups offering innovative cloud-based IP portfolio solutions.
To get more information on this market Request Sample
Australia's market is being propelled by government-led IP system modernization, exemplified by the implementation of the Intellectual Property Laws Amendment (Regulator Performance) Act 2023 which refined trademark and patent administration processes to enhance efficiency and legal clarity. In January 2024, IP Australia announced that it would adopt the internationally recognized Madrid Goods and Services list (Madrid List). The Madrid List was expected to take over the existing Trade Mark Goods and Services list in March 2024. The change brought IP Australia’s classification of goods and services for trademark applications into harmony with other international intellectual property offices, such as the World Intellectual Property Organization (WIPO). The innovation ecosystem is witnessing growing university-industry partnerships, with commercialization agreements increasing 14% across biotechnology, engineering, and clean energy disciplines as institutions deploy digital technology transfer platforms to simplify licensing negotiations. IP-active firms now employ a large number of Australian workers, with IP-right owners accounting for 35% of Australia's GDP, demonstrating the substantial economic contribution of effective IP management. The creative industries particularly benefit from robust IP frameworks, highlighting the financial value of structured IP licensing practices and comprehensive portfolio management systems.
Australia Intellectual Property Management Market Trends:
Accelerating Adoption of AI-Powered IP Analytics and Automation
Leading Australian law firms are deploying AI-powered patent analytics suites that integrate machine learning tools to analyze claim language, predict patent strength, and scan global databases for infringement risks, enabling faster decision-making and more comprehensive prior art searches. Early adoption among technology and biotechnology companies has increased demand for automated IP insights that reduce manual review burdens while improving portfolio assessment accuracy. These AI systems employ natural language processing algorithms to evaluate patent specifications against technical standards, identify potential licensing opportunities through semantic analysis, and generate predictive intelligence about competitor IP strategies. Moreover, the government is launching favorable AI plans to promote its adoption among various industries in the country. For instance, in 2025, the Albanese administration has unveiled Australia’s National AI Plan, setting up a structured framework to steer the integration, regulation, and growth of AI-related technologies nationwide. The strategy aims to guarantee that technology benefits individuals, fosters economic development, and enhances Australia’s standing in the worldwide AI landscape.
Cloud-Based IP Management Platform Migration
Australian enterprises are aggressively transitioning from on-premises IP management systems to cloud-based SaaS platforms that offer superior scalability, accessibility, and integration capabilities essential for modern distributed work environments. In 2025, the Australian Digital Transformation Agency (DTA) urged the country's government to embrace additional cloud computing technologies. According to iTNews and ARN, the DTA's updated policy aims to "promote faster cloud adoption" among government departments. It does not explicitly prohibit the utilization of on-premises hardware, though. The policy stated that focusing on cloud computing requires agencies to evaluate cloud for new digital projects, prioritize the shift from legacy systems to cloud when appropriate, and explore hybrid or multi-cloud models when purely cloud solutions are not warranted. The DTA aims to help the government modernize its core systems and improve how Australians access and engage with public services.
University-Industry IP Partnership Proliferation
Australia's innovation ecosystem is experiencing a significant expansion in university-industry IP partnerships as research institutions recognize the commercial potential of their intellectual property assets and deploy sophisticated technology transfer mechanisms. Several major universities have introduced digital technology transfer platforms to simplify licensing negotiations, streamline material transfer agreements, and facilitate collaborative research arrangements with industry partners. The proliferation of these partnerships is evidenced by a 14% increase in commercialization agreements across biotechnology, engineering, and clean-energy disciplines during 2024, reflecting growing confidence in structured IP commercialization pathways. Universities are progressively implementing professional IP management systems to record invention disclosures, oversee patent prosecution schedules, track licensing revenues, and evaluate technology transfer performance indicators, generating ongoing demand for specialized IP software that meets the distinct needs of academic research commercialization.
Market Outlook 2026-2034:
Australia IP management market is poised for sustained expansion as businesses increasingly recognize intellectual property as a critical strategic asset requiring professional management infrastructure comparable to other essential business resources. The market generated a revenue of USD 168.97 Million in 2025 and is projected to reach a revenue of USD 545.20 Million by 2034, growing at a compound annual growth rate of 13.90% from 2026-2034. Government initiatives supporting IP awareness among small and medium enterprises, combined with simplified filing procedures through digital platforms, will drive adoption among previously underserved market segments lacking dedicated IP counsel. The proliferation of AI-powered analytics tools will democratize access to sophisticated portfolio intelligence, enabling smaller organizations to conduct competitive landscape analyses and strategic portfolio planning previously available only to large enterprises with dedicated IP departments, thereby broadening the addressable market and accelerating platform adoption across diverse industry verticals.
Australia Intellectual Property Management Market Report Segmentation:
|
Segment Category |
Leading Segment |
Market Share |
|
Component |
Service |
56% |
|
Deployment Mode |
Cloud |
61% |
|
Application |
Patent Management |
33% |
|
End User |
IT and Telecom |
20% |
|
Region |
Australia Capital Territory & New South Wales |
25% |
Component Insights:
- Software
- Service
Service dominates with a market share of 56% of the total Australia intellectual property management market in 2025.
The service segment's dominance reflects enterprises' fundamental reliance on specialized IP consulting expertise to navigate the complex legal, technical, and strategic dimensions of intellectual property portfolio management. Professional IP services encompass a comprehensive range of offerings including patent prosecution support, trademark clearance searches, freedom-to-operate analyses, IP due diligence for mergers and acquisitions, licensing negotiation assistance, and litigation support, all requiring deep domain knowledge that extends beyond software capabilities. The service segment's value proposition extends to strategic advisory functions where experienced IP professionals guide organizations in portfolio optimization decisions, competitive intelligence interpretation, and IP monetization strategies that software platforms alone cannot provide.
Small and medium enterprises (SMEs) particularly rely on external service providers to compensate for lack of in-house IP expertise, accessing specialized knowledge for patent landscape assessments, trademark portfolio audits, and licensing opportunity identification without maintaining dedicated IP staff. Large multinational corporations engage premium service providers for complex matters including standard essential patent portfolio analysis, patent pool participation strategy, and multi-jurisdictional litigation coordination requiring intimate knowledge of diverse legal frameworks, technical standards, and industry practices. The consulting dimension encompasses IP valuation for financial reporting, technology transfer facilitation for university-industry partnerships, and IP training programs for internal legal and R&D teams, creating recurring revenue streams that complement software licensing revenues and establish long-term client relationships based on trusted advisory relationships rather than transactional software sales.
Deployment Mode Insights:
- On-Premises
- Cloud
Cloud leads with a share of 61% of the total Australia intellectual property management market in 2025.
Cloud deployment's market leadership stems from its fundamental alignment with contemporary business requirements for remote accessibility, operational flexibility, and cost-effective scalability that on-premises systems cannot match without substantial infrastructure investments. Australian public cloud spending increased in 2025, reflecting widespread enterprise recognition of cloud platforms' superior economics and operational advantages. Cloud-based IP management platforms eliminate the need for expensive server infrastructure, dedicated IT support personnel, and periodic software upgrade projects, instead providing continuous feature updates, automatic security patches, and elastic capacity that scales seamlessly with portfolio growth and organizational expansion.
The cloud deployment model offers particular advantages for IP management workflows that inherently require collaboration among geographically distributed stakeholders including internal legal teams, external law firms, patent agents, and business unit personnel across multiple office locations and international markets. Cloud platforms enable real-time access to centralized IP repositories from any internet-connected device, facilitating remote portfolio reviews, collaborative prosecution strategy discussions, and immediate deadline compliance verification without geographic constraints or VPN complexity. The subscription-based pricing models typical of cloud deployments align with organizational budgeting preferences, replacing large upfront capital expenditures with predictable monthly operational expenses that can be adjusted as business needs evolve.
Application Insights:
Access the comprehensive market breakdown Request Sample
- Licensing
- Patent Management
- Trademark Management
- Others
Patent management exhibits a clear dominance with a 33% share of the total Australia intellectual property management market in 2025.
Patent management applications command the leading position due to the inherent complexity and resource intensity of patent prosecution workflows that demand specialized software capabilities for docketing, document management, and prosecution analytics across extended multi-year timeframes. IP Australia received 30,478 standard patent applications in 2024, with national phase entry from PCT applications being the preferred filing route, demonstrating substantial prosecution activity requiring systematic tracking of examination responses, office action deadlines, and multi-jurisdictional filing strategies.
Patent management software addresses the operational challenges of maintaining large patent portfolios across multiple technology areas and geographic markets, providing automated deadline tracking that prevents costly lapses, centralized document repositories that organize thousands of prosecution documents, and portfolio analytics that identify maintenance cost optimization opportunities through strategic abandonment decisions. The technical nature of patent assets necessitates specialized search capabilities that enable patent professionals to conduct prior art investigations, identify potentially conflicting third-party rights, and evaluate freedom-to-operate issues before product launches, functionalities that require integration with patent classification systems, technical databases, and semantic search algorithms. Organizations managing portfolios spanning hundreds or thousands of patent families depend on these platforms to generate prosecution budgets, forecast renewal expenses across multi-decade lifecycles, and provide executive dashboards summarizing portfolio compositions.
End User Insights:
- IT and Telecom
- BFSI
- Manufacturing
- Healthcare
- Automotive
- Others
IT and telecom lead with a share of 20% of the total Australia intellectual property management market in 2025.
The IT and telecommunications sector's leadership position reflects the industry's fundamental reliance on intellectual property as a core competitive asset, with patent portfolios serving as essential strategic tools for market positioning, licensing revenue generation, and defensive protection against competitor litigation threats. The sector's innovation intensity necessitates robust IP protection for software patents covering algorithms and data structures, technology trademarks establishing brand recognition for digital services, and design registrations protecting user interface innovations, all requiring comprehensive management systems to coordinate prosecution activities, monitor competitor filings, and support licensing negotiations with technology partners and standards organizations.
Telecommunications companies manage particularly complex patent portfolios encompassing standard essential patents that must be licensed on fair, reasonable, and non-discriminatory terms to industry participants implementing technical standards like 5G wireless protocols, creating intricate licensing programs that demand sophisticated IP management infrastructure for royalty tracking, compliance monitoring, and dispute resolution. Software companies leverage trademark portfolios to protect brand equity in crowded competitive markets, requiring systematic trademark watching services to identify potentially conflicting third-party applications, comprehensive renewal management to maintain registration validity across multiple jurisdictions, and enforcement monitoring to detect unauthorized use of protected marks in digital commerce channels. The rapid pace of technological evolution in IT and telecommunications sectors generates continuous innovation cycles that produce high volumes of invention disclosures requiring evaluation, patent applications demanding prosecution management, and portfolio optimization decisions necessitating analytics capabilities that specialized IP management platforms provide through automated workflows, centralized data repositories, and strategic decision support tools tailored to technology sector requirements.
Regional Insights:
- Australia Capital Territory & New South Wales
- Victoria & Tasmania
- Queensland
- Northern Territory & Southern Australia
- Western Australia
Australia Capital Territory & New South Wales exhibit a clear dominance with a 25% share of the total Australia intellectual property management market in 2025.
Australia Capital Territory and New South Wales's market leadership stems from the concentration of government institutions in Canberra and corporate technology hubs in Sydney that collectively generate substantial demand for sophisticated IP management infrastructure to support regulatory compliance, commercial operations, and innovation commercialization activities. Canberra hosts IP Australia and numerous federal government departments implementing digital transformation initiatives that require systematic IP management for government-funded research outcomes, software development projects, and data sharing frameworks across inter-departmental collaborations. Sydney's position as Australia's primary financial and technology center concentrates multinational corporations, professional service firms, and venture-backed startups that maintain substantial patent and trademark portfolios requiring professional management services, advanced software platforms, and specialized legal expertise available through the region's deep talent pool and established professional networks.
The region benefits from proximity to leading research universities including Australian National University, University of Sydney, and University of New South Wales, which collectively generate significant intellectual property through research activities spanning medicine, engineering, computer science, and clean energy technologies requiring technology transfer offices to employ sophisticated IP management systems for invention disclosure processing, patent prosecution coordination, and licensing agreement administration. Sydney's status as a regional headquarters location for global technology companies creates concentrated demand for enterprise-grade IP management solutions that support large international patent portfolios, complex trademark portfolios spanning multiple brand families, and licensing programs involving thousands of agreements across diverse product categories and geographic markets. The availability of specialized IP law firms, patent attorney practices, and IP consulting boutiques in Sydney establishes a professional services ecosystem that drives service segment revenues while creating demonstration effects that encourage broader IP management software adoption among organizations observing competitors' successful implementation of comprehensive IP portfolio management infrastructure.
Market Dynamics:
Growth Drivers:
Why is the Australia Intellectual Property Management Market Growing?
Government Digital Infrastructure Standardization and IP Reforms
Australian government initiatives are fundamentally transforming the IP management landscape through regulatory reforms that streamline administration processes, enhance legal clarity, and promote international harmonization of IP systems, creating favorable conditions for market expansion. In March 2024, the Intellectual Property Laws Amendment (Regulator Performance) Act 2023 and Regulations 2024 introduced comprehensive reforms to Australia's IP management framework by refining trademark and patent administration procedures, enhancing legal clarity on Olympic insignia trademark registration, adjusting renewal grace periods to provide greater flexibility for rights holders, addressing administrative oversights regarding missed opposition notices, and enabling trademark restoration in specific circumstances to strengthen Australia's IP system resilience. These government-led improvements reduce administrative friction, decrease compliance costs, and enhance predictability of IP rights acquisition and maintenance, encouraging organizations to expand their Australian IP portfolios.
Expanding Innovation Economy and Patent Filing Activity
Australia's sustained innovation activity across technology, biotechnology, and creative sectors is generating continuous growth in patent and trademark filings that require professional management services and sophisticated software platforms to handle increasing portfolio complexity and administrative burdens. IP Australia received 30,478 standard patent applications in 2024, demonstrating substantial invention activity despite global economic uncertainties, with Australian resident applications increment reflecting sustained domestic innovation across engineering, pharmaceutical, software, and clean energy technology domains. Trademark applications rose 2.8% to reach 85,945 filings in 2024. This expanding volume of IP rights necessitates comprehensive management infrastructure to track prosecution deadlines across thousands of applications, coordinate renewal payments for maturing portfolios, monitor competitor filing activities for strategic intelligence, and analyze portfolio composition for optimization decisions.
Cross-Border Licensing and International Collaboration Growth
International cooperation and licensing arrangements are increasingly defining IP management requirements in Australia as organizations pursue global market opportunities, access foreign technologies through inbound licensing, and monetize Australian innovations through outbound licensing programs spanning multiple jurisdictions and technology domains. Australia gaming market reached USD 2.5 Billion in 2024, as per the predictions of IMARC Group. This is driven by enhanced cooperation between game developers and music experts that showcases the commercial value of strategic IP licensing arrangements requiring careful rights clearance, royalty structure negotiation, and ongoing compliance monitoring across complex multi-party agreements. The Australian IP Report highlights that for creative and cultural industries, collaboration and licensing are key factors driving economic value, with more than USD 700 million in royalties paid to Australian creators and artists via collecting societies during the 2022-23 financial year, demonstrating the substantial financial flows generated through structured licensing frameworks that demand professional administration to ensure accurate royalty calculations, timely payments, and dispute resolution. The complexity of cross-border licensing increases exponentially with the number of jurisdictions involved, each presenting unique legal requirements, tax implications, and enforcement mechanisms that specialized IP management systems help navigate through multi-jurisdictional deadline tracking, currency conversion automation, and compliance monitoring capabilities that ensure licensing programs operate efficiently across diverse regulatory environments.
Market Restraints:
What Challenges the Australia Intellectual Property Management Market is Facing?
Shortage of Specialized IP Management Expertise
Australian organizations face significant challenges recruiting and retaining professionals with specialized expertise in intellectual property management, encompassing patent prosecution strategy, trademark portfolio optimization, licensing negotiation, and IP analytics interpretation, creating implementation barriers for comprehensive IP management programs. Many organizations lack experienced personnel who understand advanced IP architecture principles, portfolio lifecycle management best practices, and cross-jurisdictional compliance requirements, resulting in poorly designed IP strategies that fail to align with business objectives, inefficient portfolio maintenance creating unnecessary expense, and missed monetization opportunities from underutilized assets. The technical complexity of implementing robust IP management systems requires personnel capable of evaluating software platform capabilities, configuring workflows to organizational requirements, integrating systems with existing enterprise infrastructure, and training user communities on best practices, competencies that are scarce in smaller organizations lacking dedicated IP departments.
Complex Regulatory Compliance and Data Sovereignty Requirements
Organizations navigating Australia's evolving data protection regulatory landscape face substantial challenges ensuring IP management systems comply with the Privacy Act 1988 and Notifiable Data Breaches scheme, which impose strict requirements on how IP-related personal data including inventor information, applicant details, and licensing counterparty information is collected, stored, processed, and protected. The absence of universally accepted IP management standards across specific industry sectors creates integration complexity as organizations must customize implementations for each partner's unique specifications, extending deployment timelines, increasing development costs, and complicating ongoing maintenance as systems evolve to accommodate changing regulatory requirements and business relationships. Cloud-based IP management platforms must address data sovereignty concerns regarding where sensitive IP information is stored and processed, potentially requiring Australian data residency guarantees that limit provider options and increase costs.
Cybersecurity Vulnerabilities in IP Digital Platforms
The digitization of IP portfolios through cloud-based management platforms exposes organizations to heightened cybersecurity risks including unauthorized access attempts, data breach incidents, and intellectual property theft through sophisticated cyberattacks specifically targeting valuable patent specifications, trade secret documentation, and licensing agreement terms. The potential consequences of IP data breaches extend beyond immediate information loss to encompass long-term competitive disadvantage from disclosure of proprietary technologies, licensing strategy revelation enabling competitor counter-strategies, and loss of trade secret protection where confidential information becomes publicly accessible through security incidents.
Competitive Landscape:
The Australia intellectual property management market exhibits a dynamic competitive structure with global enterprise legal technology providers offering comprehensive IP management suites alongside specialized vendors focused exclusively on patent analytics, trademark watching, or licensing administration capabilities tailored to specific IP asset classes. Domestic Australian technology enterprises provide IP management software and professional services while building proprietary platforms optimized for local regulatory requirements, government filing system integrations, and Australian legal practice workflows. The ecosystem includes boutique consulting firms offering specialized IP strategy advisory, portfolio optimization services, and technology transfer facilitation that complement software platforms with human expertise essential for complex decision-making. Professional service firms and law firms with dedicated IP practices compete for service segment revenues through comprehensive prosecution support, licensing negotiation assistance, and litigation management offerings that leverage deep technical expertise and established relationships with IP Australia and foreign patent offices. The market demonstrates increasing collaboration between traditional IP law firms and technology vendors who partner to deliver integrated solutions combining legal expertise with analytical software capabilities, creating value propositions that address the full spectrum of client needs from strategic planning through operational execution to enforcement and monetization.
Australia Intellectual Property Management Market Report Coverage:
| Report Features | Details |
|---|---|
| Base Year of the Analysis | 2025 |
| Historical Period | 2020-2025 |
| Forecast Period | 2026-2034 |
| Units | Million USD |
| Scope of the Report |
Exploration of Historical Trends and Market Outlook, Industry Catalysts and Challenges, Segment-Wise Historical and Future Market Assessment:
|
| Components Covered | Software, Service |
| Deployment Modes Covered | On-Premises, Cloud |
| Applications Covered | Licensing, Patent Management, Trademark Management, Others |
| End Users Covered | IT and Telecom, BFSI, Manufacturing, Healthcare, Automotive, Others |
| Regions Covered | Australia Capital Territory & New South Wales, Victoria & Tasmania, Queensland, Northern Territory & Southern Australia, Western Australia |
| Customization Scope | 10% Free Customization |
| Post-Sale Analyst Support | 10-12 Weeks |
| Delivery Format | PDF and Excel through Email (We can also provide the editable version of the report in PPT/Word format on special request) |
Key Questions Answered in This Report
The Australia intellectual property management market size was valued at USD 168.97 Million in 2025.
The Australia intellectual property management market is expected to grow at a compound annual growth rate of 13.90% from 2026-2034 to reach USD 545.20 Million by 2034.
Service dominates the Australia intellectual property management market with a 56% share in 2025, driven by enterprises' fundamental reliance on specialized IP consulting expertise for patent prosecution support, trademark clearance searches, freedom-to-operate analyses, IP due diligence for mergers and acquisitions, licensing negotiation assistance, and litigation support, all requiring deep domain knowledge that extends beyond software platform capabilities.
Key factors driving the Australia intellectual property management market include government-led digital infrastructure standardization through the Intellectual Property Laws Amendment Act 2023 and IP Australia's adoption of Madrid Goods and Services list streamlining international filings, expanding innovation economy, and cross-border licensing growth generating USD 700 million in royalties requiring sophisticated administration infrastructure for multi-jurisdictional agreement compliance and royalty tracking.
Major challenges include shortage of specialized IP management expertise creating implementation barriers particularly for small and medium enterprises lacking dedicated IP personnel to configure systems and develop strategies, complex regulatory compliance requirements under Privacy Act 1988 and data sovereignty concerns limiting cloud platform adoption, and cybersecurity vulnerabilities of organizations experiencing cyberattacks potentially exposing sensitive patent specifications and licensing agreement terms to unauthorized access and competitive intelligence gathering.
Need more help?
- Speak to our experienced analysts for insights on the current market scenarios.
- Include additional segments and countries to customize the report as per your requirement.
- Gain an unparalleled competitive advantage in your domain by understanding how to utilize the report and positively impacting your operations and revenue.
- For further assistance, please connect with our analysts.
 Request Customization
 Speak to an Analyst
 Request Brochure
 Inquire Before Buying
Benefits of Customization
- Personalize this research
- Triangulate with your data
- Get data as per your format and definition
- Gain a deeper dive into a specific application, geography, customer, or competitor
- Any level of personalization
Get in Touch With Us
UNITED STATES
Phone: +1-201-971-6302
INDIA
Phone: +91-120-433-0800
UNITED KINGDOM
Phone: +44-753-714-6104
Email: sales@imarcgroup.com
Client Testimonials


.webp)


