
Asia Pacific Solar Microinverter Market Size, Share, Trends and Forecast by Connectivity, Component, Communication Channel, Type, Application, and Country, 2025-2033
Market Overview:
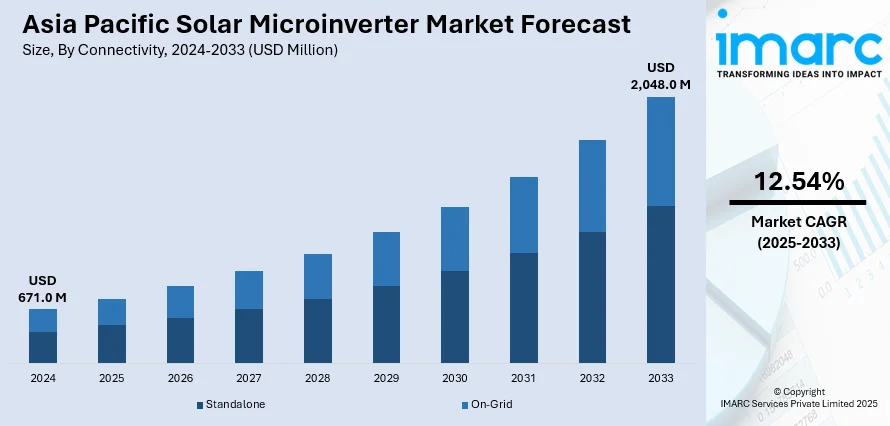
The Asia Pacific solar microinverter market size reached USD 671.0 Million in 2024. Looking forward, IMARC Group expects the market to reach USD 2,048.0 Million by 2033, exhibiting a growth rate (CAGR) of 12.54% during 2025-2033.
|
Report Attribute
|
Key Statistics
|
|---|---|
|
Base Year
|
2024
|
|
Forecast Years
|
2025-2033
|
|
Historical Years
|
2019-2024
|
|
Market Size in 2024
|
USD 671.0 Million |
|
Market Forecast in 2033
|
USD 2,048.0 Million |
| Market Growth Rate (2025-2033) | 12.54% |
A solar microinverter refers to a device that converts direct current (DC) generated by a solar panel into alternating current. It differs from string inverters and central inverters as the solar microinverter is attached to solar panels and converts the current separately. It has various benefits, such as the ability to increasing the power by using the Maximum Power Point Tracking (MPPT) technology and maintaining a consistent flow of energy compared to its conventional counterparts. Solar microinverters are gaining traction across the Asia Pacific region due to the increasing environmental concerns.
To get more information on this market, Request Sample
The Asia Pacific solar microinverter market is primarily driven by the rising shift from fossil fuel-based energy generation toward more sustainable and cleaner power source alternatives. Besides this, the implementation of favorable regulations and numerous government subsidies have resulted in the installation of solar power infrastructures, including microinverters. Furthermore, the customization of solar microinverter as per the requirement of users and the extended warranty period, along with increasing adoption of building-integrated photovoltaics, is also catalyzing the market growth.
Key Market Segmentation:
IMARC Group provides an analysis of the key trends in each sub-segment of the Asia Pacific solar microinverter market report, along with forecasts at the regional and country level from 2025-2033. Our report has categorized the market based on connectivity, component, communication channel, type, and application.
Breakup by Connectivity:
- Standalone
- On-Grid
Breakup by Component:
- Hardware
- Software
Breakup by Communication Channel:
- Wired
- Wireless
Breakup by Type:
- Single Phase
- Three Phase
Breakup by Application:
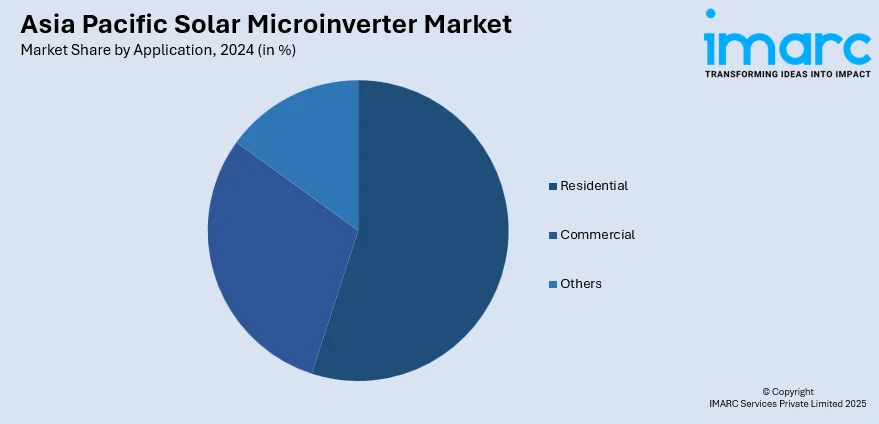
- Residential
- Commercial
- Others
Breakup by Country:
- China
- Japan
- India
- South Korea
- Australia
- Indonesia
- Others
Competitive Landscape:
The competitive landscape of the industry has also been examined along with the profiles of the key players.
Report Coverage:
| Report Features | Details |
|---|---|
| Base Year of the Analysis | 2024 |
| Historical Period | 2019-2024 |
| Forecast Period | 2025-2033 |
| Units | Million USD |
| Segment Coverage | Connectivity, Component, Communication Channel, Type, Application, Country |
| Countries Covered | China, Japan, India, South Korea, Australia, Indonesia, Others |
| Customization Scope | 10% Free Customization |
| Post-Sale Analyst Support | 10-12 Weeks |
| Delivery Format | PDF and Excel through Email (We can also provide the editable version of the report in PPT/Word format on special request) |
Key Questions Answered in This Report:
- How has the Asia Pacific solar microinverter market performed so far and how will it perform in the coming years?
- What has been the impact of COVID-19 on the Asia Pacific solar microinverter market?
- What are the key regional markets?
- What is the breakup of the market based on the connectivity?
- What is the breakup of the market based on the component?
- What is the breakup of the market based on the communication channel?
- What is the breakup of the market based on the type?
- What is the breakup of the market based on the application?
- What are the various stages in the value chain of the industry?
- What are the key driving factors and challenges in the industry?
- What is the structure of the Asia Pacific solar microinverter market and who are the key players?
- What is the degree of competition in the industry?
Need more help?
- Speak to our experienced analysts for insights on the current market scenarios.
- Include additional segments and countries to customize the report as per your requirement.
- Gain an unparalleled competitive advantage in your domain by understanding how to utilize the report and positively impacting your operations and revenue.
- For further assistance, please connect with our analysts.
 Request Customization
 Speak to an Analyst
 Request Brochure
 Inquire Before Buying
Benefits of Customization
- Personalize this research
- Triangulate with your data
- Get data as per your format and definition
- Gain a deeper dive into a specific application, geography, customer, or competitor
- Any level of personalization
Get in Touch With Us
UNITED STATES
Phone: +1-201-971-6302
INDIA
Phone: +91-120-433-0800
UNITED KINGDOM
Phone: +44-753-714-6104
Email: sales@imarcgroup.com
Client Testimonials


.webp)


