Asia Pacific Scintillator Market Size, Share, Trends and Forecast by Composition of Material, End Product, Application, and Country, 2026-2034
Market Overview:
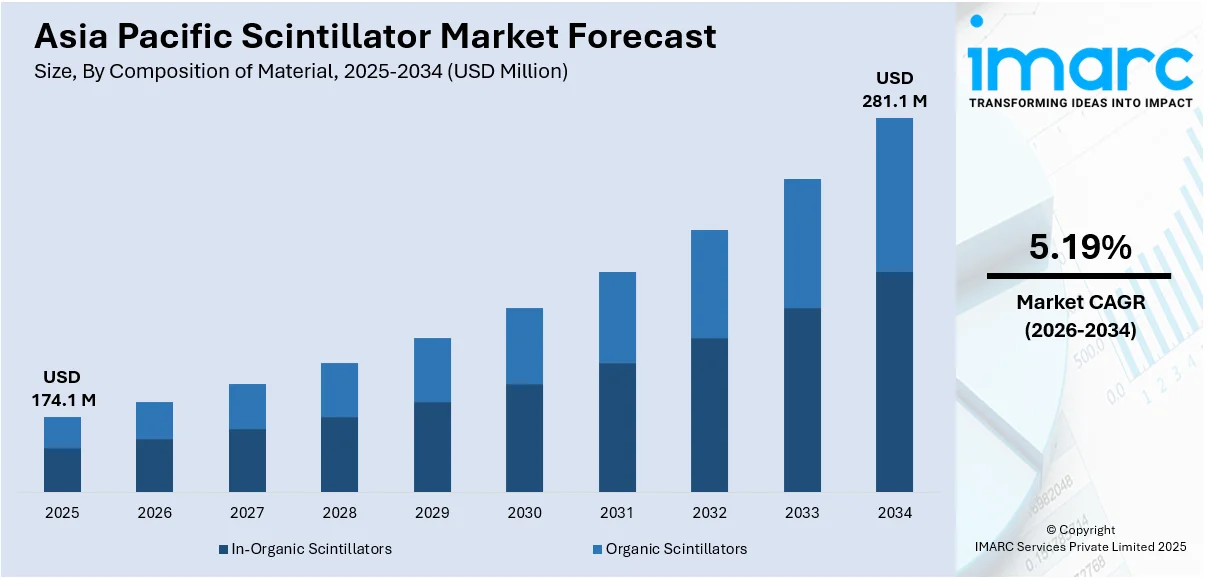
The Asia Pacific scintillator market size reached USD 174.1 Million in 2025. Looking forward, IMARC Group expects the market to reach USD 281.1 Million by 2034, exhibiting a growth rate (CAGR) of 5.19% during 2026-2034.
|
Report Attribute
|
Key Statistics
|
|---|---|
|
Base Year
|
2025
|
|
Forecast Years
|
2026-2034
|
|
Historical Years
|
2020-2025
|
|
Market Size in 2025
|
USD 174.1 Million |
|
Market Forecast in 2034
|
USD 281.1 Million |
| Market Growth Rate 2026-2034 | 5.19% |
Scintillators are materials that can absorb high-energy photons and incident particles, including protons, electrons and neutrons. These materials are durable and cost-effective and offer high density, fast operation speed, and radiation hardness. Consequently, they are utilized in particle detectors, new energy resource exploration and gas exploration. They also find applications in computed tomography (CT) scanners, gamma cameras and X-ray security in the Asia Pacific region.

To get more information on this market Request Sample
The growing prevalence of chronic diseases represents one of the key factors escalating the demand for scintillators in the healthcare sector. Moreover, they are utilized in nuclear and particle physics to detect and measure radioactive contamination and monitor nuclear material and waste. They are also used in non-destructive testing (NDT) and thermal neutron activation analysis. This, along with the increasing adoption of alternative energy sources and the rising number of upcoming nuclear reactors, is strengthening the market growth. Furthermore, increasing national security concerns are expanding the applications of scintillators in the defense and military sector. Besides this, the development of affordable and high-performance products, coupled with rising investments in research and development (R&D) activities, is anticipated to bolster the market growth.
Key Market Segmentation:
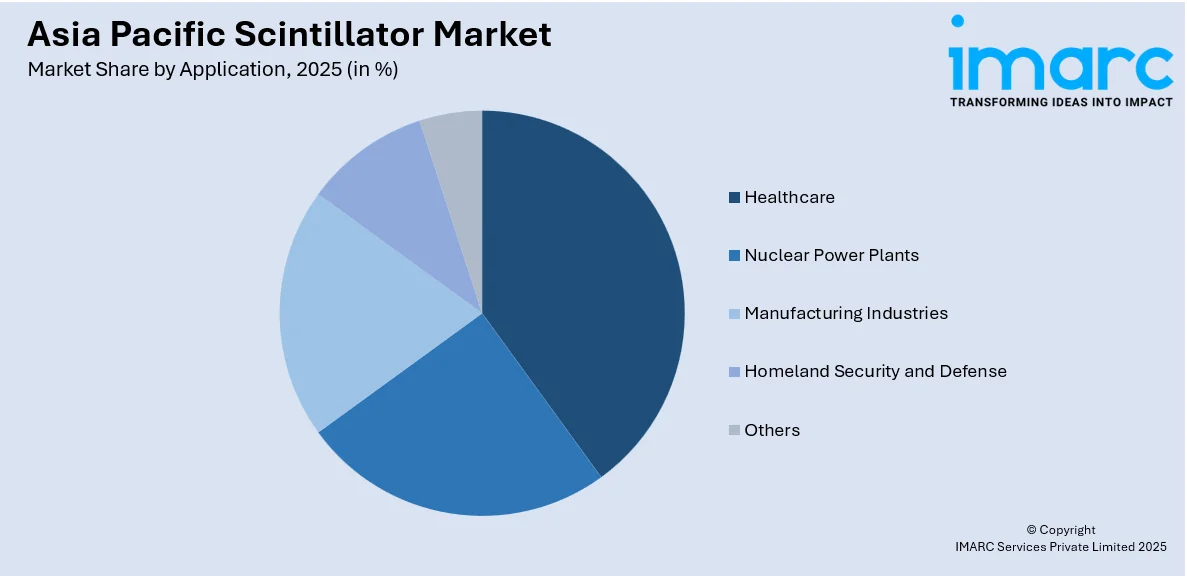
IMARC Group provides an analysis of the key trends in each sub-segment of the Asia Pacific scintillator market report, along with forecasts at the regional and country level from 2026-2034. Our report has categorized the market based on composition of material, end product and application.
Breakup by Composition of Material:
- In-Organic Scintillators
- Alkali Halides
- Oxide Based Scintillators
- Others
- Organic Scintillators
- Single Crystal
- Liquid Scintillators
- Plastic Scintillators
Breakup by End Product:
- Personal or Pocket Size Instruments
- Hand-Held Instruments
- Fixed, Installed, and Automatic Instruments
Breakup by Application:

Access the comprehensive market breakdown Request Sample
- Healthcare
- Nuclear Power Plants
- Manufacturing Industries
- Homeland Security and Defense
- Others
Breakup by Country:
- China
- Japan
- India
- South Korea
- Australia
- Indonesia
- Others
Competitive Landscape:
The competitive landscape of the industry has also been examined along with the profiles of the key players.
Report Coverage:
| Report Features | Details |
|---|---|
| Base Year of the Analysis | 2025 |
| Historical Period | 2020-2025 |
| Forecast Period | 2026-2034 |
| Units | Million USD |
| Segment Coverage | Composition of Material, End Product, Application, Country |
| Countries Covered | China, Japan, India, South Korea, Australia, Indonesia, Others |
| Customization Scope | 10% Free Customization |
| Post-Sale Analyst Support | 10-12 Weeks |
| Delivery Format | PDF and Excel through Email (We can also provide the editable version of the report in PPT/Word format on special request) |
Key Questions Answered in This Report:
- How has the Asia Pacific scintillator market performed so far and how will it perform in the coming years?
- What has been the impact of COVID-19 on the Asia Pacific scintillator market?
- What are the key regional markets?
- What is the breakup of the market based on the composition of material?
- What is the breakup of the market based on the end product?
- What is the breakup of the market based on the application?
- What are the various stages in the value chain of the industry?
- What are the key driving factors and challenges in the industry?
- What is the structure of the Asia Pacific scintillator market and who are the key players?
- What is the degree of competition in the industry?
Need more help?
- Speak to our experienced analysts for insights on the current market scenarios.
- Include additional segments and countries to customize the report as per your requirement.
- Gain an unparalleled competitive advantage in your domain by understanding how to utilize the report and positively impacting your operations and revenue.
- For further assistance, please connect with our analysts.
 Request Customization
 Speak to an Analyst
 Request Brochure
 Inquire Before Buying


.webp)


.webp)


