Asia Pacific Busbar Market Size, Share, Trends and Forecast by Power Rating, Conductor, End-User, Industry, and Country, 2025-2033
Market Overview:
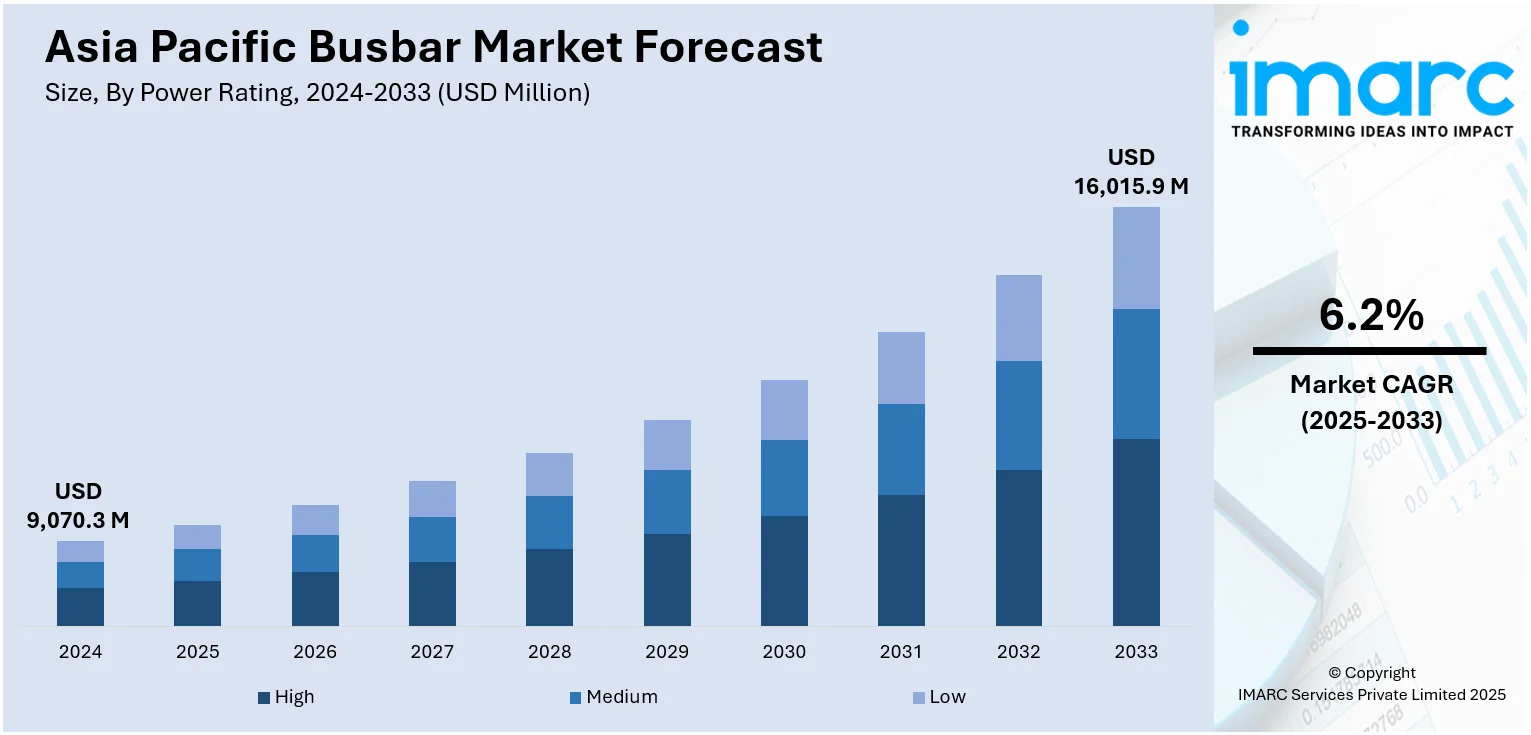
The Asia Pacific busbar market size reached USD 9,070.3 Million in 2024. Looking forward, IMARC Group expects the market to reach USD 16,015.9 Million by 2033, exhibiting a growth rate (CAGR) of 6.2% during 2025-2033.
|
Report Attribute
|
Key Statistics
|
|---|---|
|
Base Year
|
2024 |
|
Forecast Years
|
2025-2033
|
|
Historical Years
|
2019-2024
|
|
Market Size in 2024
|
USD 9,070.3 Million |
|
Market Forecast in 2033
|
USD 16,015.9 Million |
| Market Growth Rate (2025-2033) |
6.2%
|
A busbar is an electrical conductor that operates by collecting electric current from the incoming feeders and distributing it to outgoing feeders. It grounds and conducts electricity at the same time, and connects several circuits in a system. It is generally coated with materials that provide different conductivity limits and variations. The rising utilization of electricity across the residential, commercial and industrial sectors is driving the demand for busbars in the Asia Pacific region.

To get more information on this market, Request Sample
A significant rise in the demand for uninterrupted and reliable power supply, in confluence with the increasing adoption of renewable energy sources for power generation, represents one of the key factors impelling the market growth in the Asia Pacific region. Furthermore, as busbars are reliable, cost-efficient, environment-friendly, and require few installation materials and employ reusable and re-locatable plug-in outlets, they are gaining traction over cables across the region. Apart from this, governments of several countries are increasing their investments in grid expansion and modernization. They are also implementing energy-saving programs to improve energy efficiency across commercial facilities. This is projected to create a positive outlook for the market in the coming years.
Key Market Segmentation:
IMARC Group provides an analysis of the key trends in each segment of the Asia Pacific busbar market report, along with forecasts at the regional and country levels from 2025-2033. Our report has categorized the market based on power rating, conductor, end-user and industry.
Breakup by Power Rating:
- High
- Medium
- Low
Breakup by Conductor:
- Copper
- Aluminium
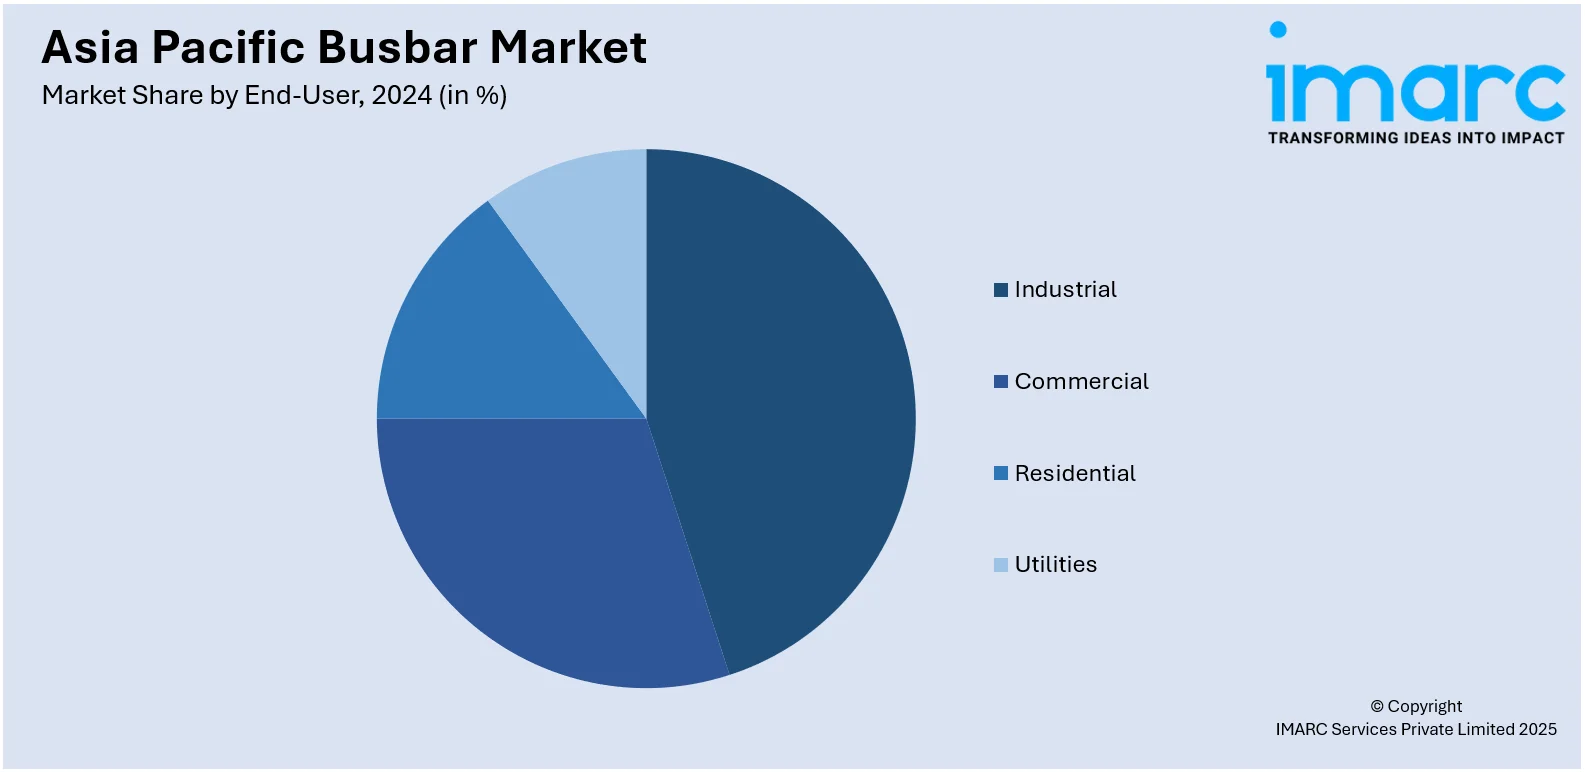
Breakup by End-User:

- Industrial
- Commercial
- Residential
- Utilities
Breakup by Industry:
- Chemicals and Petroleum
- Metals and Mining
- Manufacturing
- Others
Breakup by Country:
- China
- Japan
- India
- South Korea
- Australia
- Indonesia
- Others
Competitive Landscape:
The competitive landscape of the industry has also been examined along with the profiles of the key players.
Report Coverage:
| Report Features | Details |
|---|---|
| Base Year of the Analysis | 2024 |
| Historical Period | 2019-2024 |
| Forecast Period | 2025-2033 |
| Units | Million USD |
| Segment Coverage | Power Rating, Conductor, End-User, Industry, Country |
| Countries Covered | China, Japan, India, South Korea, Australia, Indonesia, Others |
| Customization Scope | 10% Free Customization |
| Post-Sale Analyst Support | 10-12 Weeks |
| Delivery Format | PDF and Excel through Email (We can also provide the editable version of the report in PPT/Word format on special request) |
Key Questions Answered in This Report
The busbar market in Asia Pacific was valued at USD 9,070.3 Million in 2024.
The Asia Pacific busbar market is projected to exhibit a CAGR of 6.2% during 2025-2033, reaching a value of USD 16,015.9 Million by 2033.
The Asia Pacific busbar market is driven by rapid industrialization, increasing demand for efficient power distribution, growing investments in renewable energy, and expanding infrastructure projects. Rising adoption of electric vehicles and smart grids, along with government initiatives promoting energy efficiency, further accelerate market growth across the region.
Need more help?
- Speak to our experienced analysts for insights on the current market scenarios.
- Include additional segments and countries to customize the report as per your requirement.
- Gain an unparalleled competitive advantage in your domain by understanding how to utilize the report and positively impacting your operations and revenue.
- For further assistance, please connect with our analysts.
 Request Customization
 Speak to an Analyst
 Request Brochure
 Inquire Before Buying


.webp)


.webp)


