
Asia Pacific 3D Mapping and Modeling Market Size, Share, Trends and Forecast by Component, Application, End Use Industry, and Country, 2025-2033
Market Overview:
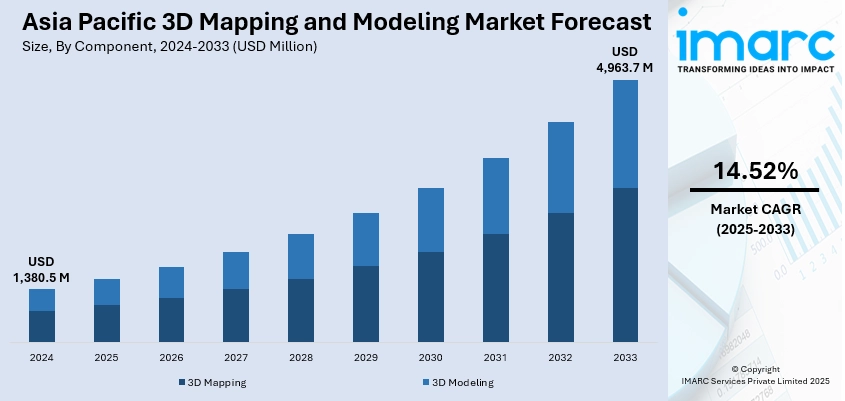
The Asia Pacific 3D mapping and modeling market size reached USD 1,380.5 Million in 2024. Looking forward, IMARC Group expects the market to reach USD 4,963.7 Million by 2033, exhibiting a growth rate (CAGR) of 14.52% during 2025-2033.
|
Report Attribute
|
Key Statistics
|
|---|---|
|
Base Year
|
2024
|
|
Forecast Years
|
2025-2033
|
|
Historical Years
|
2019-2024
|
| Market Size in 2024 | USD 1,380.5 Million |
| Market Forecast in 2033 | USD 4,963.7 Million |
| Market Growth Rate (2025-2033) | 14.52% |
3D mapping and modeling refer to the process of creating and viewing objects in three-dimension by employing machine vision and related technologies. The process involves a projection method that uses objects as a surface instead of screens, which turns it into a 3D model creating an interactive display when an animation is projected onto the object. The objects can be used as a surface ranging from structures such as buildings, theater stages, and small random objects. With the help of highly advanced software, the object can also reproduce spatially in the same environment of the rear projection. The 3D mapping and modeling technology is extensively utilized by advertisers and artists to add dimension, movement, and depth to static objects.
To get more information on this market, Request Sample
The Asia Pacific 3D mapping and modeling market is primarily driven by rapid urbanization and the growing adoption of this technology in countries such as China, India and Japan. Besides this, the adoption of 3D mapping and modeling tools by various governmental organizations to predict natural calamities like tsunami and earthquakes is also propelling the growth of the market. Additionally, the increasing use of 3D animation in different mobile applications, games, and movies and the expanding consumer electronics sector have resulted in the advent of 3D-enabled displays in the region. Moreover, the market is bolstered by the rising product demand from the research and development (R&D) sector and its application in the entertainment industry.
Key Market Segmentation:
IMARC Group provides an analysis of the key trends in each segment of the Asia Pacific 3D mapping and modeling market report, along with forecasts at the regional and country levels from 2025-2033. Our report has categorized the market based on component, application and end use industry.
Breakup by Component:
- 3D Mapping
- 3D Modeling
Breakup by Application:
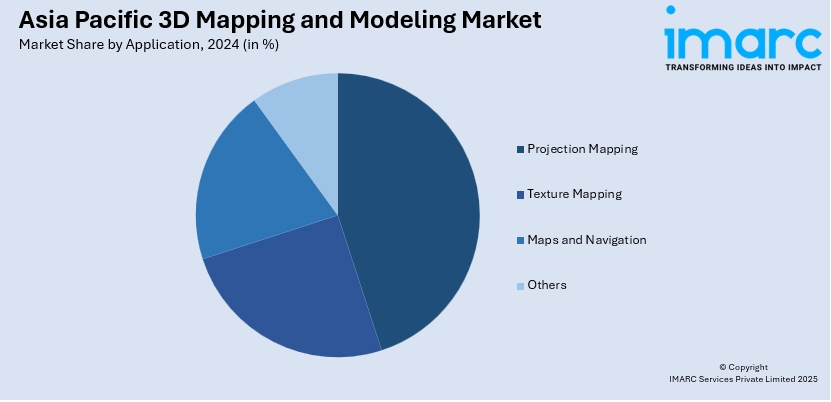
- Projection Mapping
- Texture Mapping
- Maps and Navigation
- Others
Breakup by End Use Industry:
- Construction Industry
- Transportation Industry
- Automobile Industry
- Entertainment Industry
- Healthcare Industry
- Others
Breakup by Country:
- China
- Japan
- India
- South Korea
- Australia
- Indonesia
- Others
Competitive Landscape:
The competitive landscape of the industry has also been examined along with the profiles of the key players.
Report Coverage:
| Report Features | Details |
|---|---|
| Base Year of the Analysis | 2024 |
| Historical Period | 2019-2024 |
| Forecast Period | 2025-2033 |
| Units | Million USD |
| Scope of the Report | Exploration of Historical and Forecast Trends, Industry Catalysts and Challenges, Segment-Wise Historical and Predictive Market Assessment:
|
| Components Covered | 3D Mapping, 3D Modeling |
| Applications Covered | Projection Mapping, Texture Mapping, Maps and Navigation, Others |
| End Use Industries Covered | Construction Industry, Transportation Industry, Automobile Industry, Entertainment Industry, Healthcare Industry, Others |
| Countries Covered | China, Japan, India, South Korea, Australia, Indonesia, Others |
| Customization Scope | 10% Free Customization |
| Post-Sale Analyst Support | 10-12 Weeks |
| Delivery Format | PDF and Excel through Email (We can also provide the editable version of the report in PPT/Word format on special request) |
Key Questions Answered in This Report
The 3D mapping and modeling market in Asia Pacific was valued at USD 1,380.5 Million in 2024.
Government agencies and private developers are utilizing 3D modeling for smart city development, simulation, and disaster management planning. In entertainment and gaming, high-quality 3D visuals are enhancing user experiences, driving software and hardware upgrades. Additionally, the growth of augmented reality (AR) applications is encouraging investments in 3D mapping tools.
The Asia Pacific 3D mapping and modeling market is projected to exhibit a CAGR of 14.52% during 2025-2033, reaching a value of USD 4,963.7 Million by 2033.
Need more help?
- Speak to our experienced analysts for insights on the current market scenarios.
- Include additional segments and countries to customize the report as per your requirement.
- Gain an unparalleled competitive advantage in your domain by understanding how to utilize the report and positively impacting your operations and revenue.
- For further assistance, please connect with our analysts.
 Request Customization
 Speak to an Analyst
 Request Brochure
 Inquire Before Buying
Benefits of Customization
- Personalize this research
- Triangulate with your data
- Get data as per your format and definition
- Gain a deeper dive into a specific application, geography, customer, or competitor
- Any level of personalization
Get in Touch With Us
UNITED STATES
Phone: +1-201-971-6302
INDIA
Phone: +91-120-433-0800
UNITED KINGDOM
Phone: +44-753-714-6104
Email: sales@imarcgroup.com
Client Testimonials


.webp)


