
Aluminosilicate Prices, Trend, Chart, Demand, Market Analysis, News, Historical and Forecast Data Report 2026 Edition
Aluminosilicate Price Trend, Index and Forecast
Track the latest insights on aluminosilicate price trend and forecast with detailed analysis of regional fluctuations and market dynamics across North America, Latin America, Central Europe, Western Europe, Eastern Europe, Middle East, North Africa, West Africa, Central and Southern Africa, Central Asia, Southeast Asia, South Asia, East Asia, and Oceania.
Aluminosilicate Prices Outlook Q2 2026
- USA: USD 1005/MT
- Japan: USD 570/MT
- Germany: USD 928/MT
- South Africa: USD 667/MT
- Brazil: USD 735/MT
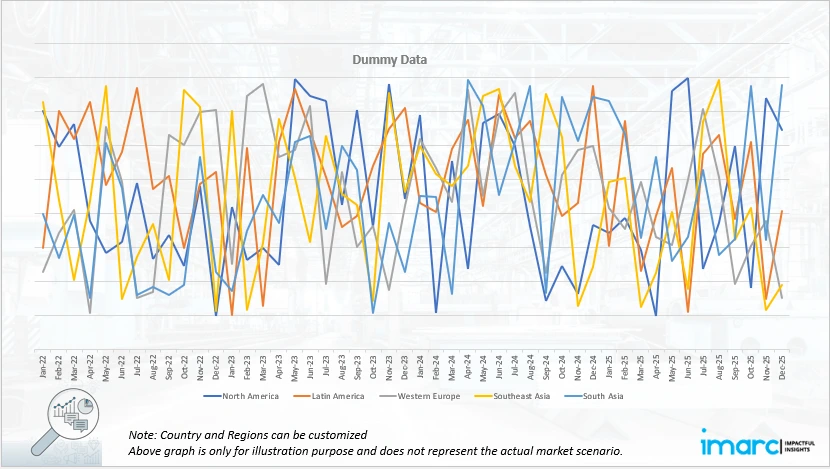
Aluminosilicate Price Chart
Get real-time access to monthly/quarterly/yearly prices Request Sample
During the second quarter of 2026, the aluminosilicate prices in the USA reached 1005 USD/MT in June. Prices declined as weaker demand from the construction materials sector reduced purchasing activity across the market. Slower consumption from applications such as insulation materials, cement additives, and other building related products lowered the need for additional inventory replenishment. At the same time, increased domestic production improved material availability and reduced supply concerns among distributors and end users.
During the second quarter of 2026, the aluminosilicate prices in Japan reached 570 USD/MT in June. Prices decreased as slower activity in the electronics sector reduced demand for specialized aluminosilicate applications. Lower procurement requirements from manufacturers affected overall market activity and encouraged suppliers to adopt more competitive pricing strategies. The availability of lower cost imports from neighboring countries further increased competition for domestic producers and placed pressure on local quotations.
During the second quarter of 2026, the aluminosilicate prices in Germany reached 928 USD/MT in June. Prices increased as demand from automotive, industrial manufacturing, and high temperature processing applications strengthened during the quarter. Aluminosilicate continued to be valued for its heat resistance and durability in demanding industrial environments, supporting regular procurement from manufacturers. Temporary supply constraints across Europe affected material availability as logistical disruptions and higher shipping expenses created challenges for distributors and buyers.
During the second quarter of 2026, the aluminosilicate prices in South Africa reached 667 USD/MT in June. Prices declined as reduced demand from the construction industry created weaker market conditions for suppliers. Lower activity in construction related applications reduced procurement volumes and increased competition among regional manufacturers holding available inventory. Higher local supply availability contributed to surplus conditions, limiting the ability of producers to maintain stronger price levels.
During the second quarter of 2026, the aluminosilicate prices in Brazil reached 735 USD/MT in June. Prices declined as increased production capacity improved regional availability and reduced supply pressure across the market. New manufacturing capacity allowed suppliers to offer greater volumes, creating stronger competition among producers and distributors. Demand from the ceramics industry weakened during the quarter, reducing procurement requirements from key downstream users.
Aluminosilicate Prices Outlook Q1 2026
- USA: USD 1015/MT
- Japan: USD 582/MT
- Germany: USD 889/MT
- South Africa: USD 671/MT
- Brazil: USD 742/MT
During the first quarter of 2026, the aluminosilicate prices in the USA reached 1015 USD/MT in March. Prices moved upward from the previous quarter as domestic buyers returned with steadier procurement from detergents, construction additives, coatings, and specialty chemical applications. Improved manufacturing sentiment supported restocking, particularly among downstream users that had kept lean inventories during the prior period. Higher logistics costs also added support, as inland freight and warehousing charges remained firm.
During the first quarter of 2026, the aluminosilicate prices in Japan reached 582 USD/MT in March. The market recorded a slight upward movement as demand from ceramics, catalysts, adsorbents, and industrial fillers remained stable. Buyers maintained cautious purchase volumes, but limited domestic supply flexibility kept offers firm. Import dependent supply chains faced added pressure from ocean freight volatility and schedule disruptions, which encouraged earlier purchasing by some downstream users.
During the first quarter of 2026, the aluminosilicate prices in Germany reached 889 USD/MT in March. Prices increased from the previous quarter as downstream consumption improved across coatings, construction materials, ceramics, and refining related applications. German buyers showed firmer interest after earlier destocking, and producers adjusted offers in line with higher utility, labor, and transport expenses. Supply conditions stayed manageable, but limited spot discounts supported the price rise.
During the first quarter of 2026, the aluminosilicate prices in South Africa reached 671 USD/MT in March. Prices moved upward as local demand from construction chemicals, detergents, paints, and water treatment applications improved. Buyers increased procurement to rebuild inventories after delayed purchases in the previous quarter. Import costs remained a key influence, with ocean freight volatility and port related delays adding pressure to delivered prices.
During the first quarter of 2026, the aluminosilicate prices in Brazil reached 742 USD/MT in March. Prices strengthened as procurement from coatings, construction products, detergents, and ceramic applications improved. Domestic buyers returned to the market after a cautious purchasing phase, and distributors raised offers in response to higher replacement costs. Import dependence for certain grades made freight and currency movement important pricing factors.
Aluminosilicate Prices Outlook Q4 2025
- USA: USD 972/MT
- Japan: USD 581/MT
- Germany: USD 877/MT
- South Africa: USD 659/MT
- Brazil: USD 711/MT
During the fourth quarter of 2025, the aluminosilicate prices in the USA reached 972 USD/MT in December. Prices moved lower as demand from construction materials, ceramics, and industrial fillers moderated. Additionally, sufficient domestic availability reduced procurement urgency. Moreover, sourcing behavior reflected cautious inventory management aligned with softened downstream consumption.
During the fourth quarter of 2025, the aluminosilicate prices in Japan reached 581 USD/MT in December. Prices edged higher as demand from ceramics, refractories, and specialty industrial applications improved. Furthermore, steady downstream utilization supported regular procurement. In addition, sourcing strategies emphasized inventory replenishment aligned with confirmed production requirements.
During the fourth quarter of 2025, the aluminosilicate prices in Germany reached 877 USD/MT in December. Prices rose supported by demand from advanced ceramics, construction additives, and specialty industrial uses. Additionally, consistent operating rates across downstream processors encouraged active sourcing. Moreover, procurement decisions focused on supply reliability and coordination with production schedules.
During the fourth quarter of 2025, the aluminosilicate prices in South Africa reached 659 USD/MT in December. Prices edged lower as demand from mining-related applications and construction materials softened. Furthermore, adequate supply availability reduced buying pressure. In addition, procurement activity reflected short-cycle purchasing aligned with immediate operational needs.
During the fourth quarter of 2025, the aluminosilicate prices in Brazil reached 711 USD/MT in December. Prices advanced as demand from construction materials, industrial fillers, and ceramics applications increased. Moreover, steady downstream consumption supported procurement activity. Additionally, sourcing strategies emphasized inventory planning aligned with ongoing project requirements.
Aluminosilicate Prices Outlook Q3 2025
- USA: USD 1006/MT
- Japan: USD 574/MT
- Germany: USD 796/MT
- South Africa: USD 663/MT
- Brazil: USD 702/MT
During the third quarter of 2025, the aluminosilicate prices in the USA reached 1006 USD/MT in September. Prices declined as softer demand from construction and ceramics aligned with broader market caution. Import flows continued uninterrupted, widening sourcing options and tempering domestic price support. Improved freight performance encouraged buyers to adopt shorter procurement cycles rather than build inventories ahead of need.
During the third quarter of 2025, the aluminosilicate prices in Japan reached 574 USD/MT in September. Prices strengthened as downstream consumption from refractory and catalyst manufacturers improved. Slightly narrowed import windows contributed to firmer domestic valuations. Currency considerations prompted buyers to plan deliveries more strategically, adding a measure of upward support to the quarter’s pricing environment.
During the third quarter of 2025, the aluminosilicate prices in Germany reached 796 USD/MT in September. Prices firmed in response to heightened purchasing from insulation, ceramics, and glass industries. Energy-related production costs continued to influence supplier offers. Imports remained available, yet increased domestic offtake kept procurement more active, contributing to a steady upward price tone throughout the quarter.
During the third quarter of 2025, the aluminosilicate prices in South Africa reached 663 USD/MT in September. Prices improved as local demand strengthened across refractories, cement additives, and metallurgical applications. Stable supply supported routine procurement, while slightly higher domestic consumption helped lift sentiment. Port operations and inland logistics functioned smoothly, allowing sellers to maintain consistent offer levels.
During the third quarter of 2025, the aluminosilicate prices in Brazil reached 702 USD/MT in September. Prices rose due to firmer interest from construction and ceramics manufacturers coupled with balanced inventory positions. Currency fluctuations affected the cost of imports, prompting some buyers to favor domestic supply. Regional freight conditions remained stable, supporting a measured but upward-leaning market trend.
Aluminosilicate Prices Outlook Q2 2025
- USA: USD 1035/MT
- Japan: USD 567/MT
- Germany: USD 736/MT
- South Africa: USD 659/MT
- Brazil: USD 698/MT
During the second quarter of 2025, the aluminosilicate prices in the USA reached 1035 USD/MT in June. Demand from construction materials, ceramics, and insulation segments remained steady, supported by consistent domestic production. Imports moved predictably through major transport hubs, ensuring reliable availability for downstream users.
During the second quarter of 2025, the aluminosilicate prices in Japan reached 567 USD/MT in June. Consumption from refractory, catalyst, and specialty materials producers stayed stable. Import-dependent supply chains functioned smoothly, and buyers adhered to structured procurement schedules amid ongoing currency and freight considerations.
During the second quarter of 2025, the aluminosilicate prices in Germany reached 736 USD/MT in June. Purchasing from industrial ceramics, insulation, and glass manufacturers remained consistent. Energy costs shaped production planning, while imports supplemented domestic supply. Distributors maintained balanced inventories in line with regular demand patterns.
During the second quarter of 2025, the aluminosilicate prices in South Africa reached 659 USD/MT in June. Refractory, mining, and cement sectors sourced steadily, supported by stable supply channels. Port activity and inland logistics facilitated predictable material movement, encouraging buyers to maintain measured purchasing practices.
During the second quarter of 2025, the aluminosilicate prices in Brazil reached 698 USD/MT in June. Demand from construction, ceramics, and metallurgical industries was stable. Reliable container availability and orderly trucking operations underpinned smooth procurement, and buyers aligned purchases with routine production cycles.
Regional Coverage
The report provides a detailed analysis of the market across different regions, each with unique pricing dynamics influenced by localized market conditions, supply chain intricacies, and geopolitical factors. This includes price trends, price forecast and supply and demand trends for each region, along with spot prices by major ports. The report also provides coverage of FOB and CIF prices, as well as the key factors influencing aluminosilicate prices.
Europe Aluminosilicate Price Trend
Q2 2026:
The aluminosilicate price index in Europe moved upward due to stronger export demand, logistics disruptions, and increased manufacturing activity. Prices were supported by port delays and shipping constraints that intermittently limited supply. The chemical industry's demand for durable materials also contributed to price stability despite fluctuations in raw material costs. Manufacturers faced higher input costs from energy and transportation, maintaining upward price pressure throughout the quarter. Buyers remained cautious as economic uncertainties influenced market negotiation dynamics. Integrated production plants in regions like Germany ensured consistent supply, offsetting potential shortages that could have further escalated prices.
Q1 2026:
The aluminosilicate price index in Europe moved as buying activity improved from construction chemicals, coatings, ceramics, and specialty industrial applications. Producers found support from firmer utility expenses, higher labor costs, and more disciplined supply management. Germany reflected this trend, with buyers returning to planned procurement after a cautious previous quarter. Import offers remained available, but freight uncertainty and longer lead times supported regional supply. Demand was not broadly aggressive, yet steady consumption helped suppliers defend higher quotations.
Q4 2025:
As per the aluminosilicate price index, prices across Europe increased, supported by demand from advanced ceramics, construction additives, and specialty industrial applications. Additionally, steady operating rates across downstream processors encouraged consistent procurement activity. Moreover, sourcing strategies emphasized inventory replenishment, supplier reliability, and alignment with confirmed production schedules, with buyers prioritizing quality compliance and supply continuity over short-term cost considerations.
Q3 2025:
Europe experienced an upward shift in pricing, reinforced by the increase seen in Germany and steady industrial consumption across France, Italy, and the Benelux region. Rising activity within insulation, glass, and specialty ceramics manufacturing resulted in stronger procurement from distributors and producers. Imported material from Brazil and South Africa supplemented regional supply, though arrivals were absorbed quickly due to active downstream production cycles. Elevated energy-related costs continued to influence European manufacturing economics, prompting suppliers to maintain firm offer levels. Transport corridors linking Central and Western Europe operated efficiently, supporting predictable replenishment for industrial clusters with sustained material requirements.
Q2 2025:
Europe maintained steady operating conditions, driven by consistent offtake from ceramics, construction materials, and industrial insulation producers. Regional manufacturers aligned their production rates with routine contractual obligations, while import arrivals from Asia and the Middle East ensured additional flexibility in sourcing. Energy expenses continued to shape the cost environment, although they did not disrupt supply planning. Inland logistics and cross-border movements remained predictable, enabling buyers to coordinate deliveries efficiently. Overall, procurement strategies were stable and aligned with established industrial activity across the continent.
Detailed price information for aluminosilicate can also be provided for an extensive list of European countries.
| Region | Countries Covered |
|---|---|
| Europe | Germany, France, United Kingdom, Italy, Spain, Russia, Turkey, Netherlands, Poland, Sweden, Belgium, Austria, Ireland, Switzerland, Norway, Denmark, Romania, Finland, Czech Republic, Portugal, and Greece, among other European countries. |
North America Aluminosilicate Price Trend
Q2 2026:
The aluminosilicate price index in North America decreased due to an over-supplied market and weaker demand from construction-related industries. Price pressure grew as competition from both domestic and international suppliers remained strong, leading to negotiation leverage for buyers. Lower transportation costs, coupled with improved logistics, allowed consistent supply, easing previous concerns over availability. Despite the downturn, niche markets within the ceramics and glass industries provided some demand consistency. Reports of output reductions at certain production facilities aimed to balance the market and stabilize pricing over the medium term, mitigating prolonged discounts and aiding recovery.
Q1 2026:
The aluminosilicate price index in North America increased as demand from detergents, paints, construction additives, and industrial fillers improved. The USA market showed stronger procurement as buyers replenished depleted inventories and shifted from hand to mouth purchasing toward regular contract coverage. Suppliers raised offers because logistics, warehousing, and raw material handling costs remained supportive. Domestic availability was adequate, but spot volumes were not heavily discounted, which helped producers maintain firmer pricing. Import competition existed, yet higher delivered costs reduced the pressure from overseas cargoes.
Q4 2025:
As per the aluminosilicate price index, prices in North America declined, influenced by moderated demand from construction materials, industrial fillers, and ceramics manufacturing. Furthermore, comfortable inventory positions reduced procurement urgency among downstream users. In addition, sourcing strategies emphasized cautious purchasing, inventory optimization, and alignment with near-term consumption visibility rather than forward stock accumulation.
Q3 2025:
Regional conditions were shaped primarily by the decline in the USA, which continued to influence procurement activity across North America. Demand from U.S. construction, refractories, and insulation segments moderated, leading buyers to adopt more cautious purchasing plans. Countries such as Canada and Mexico maintained active trade flows that supported supply continuity across the region. Imports from Germany, South Africa, and Brazil added flexibility for distributors serving a diverse set of industrial users. Logistics via major ports and inland freight corridors remained reliable, allowing supply chains to adjust smoothly to changing conditions in the United States.
Q2 2025:
The region experienced stable industrial activity with steady requirements from refractories, industrial insulation, and glass manufacturing. Domestic output aligned with contractual commitments, and supplemental imports helped maintain comfortable availability in distribution hubs. Port operations across major coastal gateways supported timely cargo movement, and rail transportation operated with few disruptions. Buyers maintained structured procurement cycles to support predictable production schedules across the quarter, resulting in balanced supply and demand conditions.
Specific aluminosilicate historical data within the United States and Canada can also be provided.
| Region | Countries Covered |
|---|---|
| North America | United States and Canada |
Middle East and Africa Aluminosilicate Price Trend
Q2 2026:
The aluminosilicate price trends across the Middle East and Africa reflected a downtrend due to increased industrial production capacity and lower demand from regional construction projects. Price declines were influenced by geopolitical stability enabling steady supply chains, which helped maintain regional inventories. Strategic alliances in raw material sourcing allowed for cost advantages, reflected in competitive pricing. The influx of imported materials and currency valuations impacted the cost-benefit dynamics, reducing pricing power for local producers. In efforts to curb further declines, suppliers adjusted output to align better with regional consumption patterns.
Q1 2026:
In the Middle East and Africa, aluminosilicate prices trended upward, supported by higher delivered costs and improved demand from detergents, coatings, construction materials, and water treatment applications. South Africa reflected this firming pattern as import replacement costs increased and local distributors raised offers. Port handling delays and longer shipping lead times encouraged buyers to secure material earlier, which reduced pressure on sellers.
Q4 2025:
Aluminosilicate market prices in the Middle East and Africa declined and were shaped by demand from construction materials, mining-related applications, and industrial processing. Additionally, procurement behavior reflected import availability, shipment scheduling, and distributor-led sourcing frameworks. Moreover, buyers focused on maintaining adequate availability to support routine industrial requirements, prioritizing supply continuity and logistics coordination.
Q3 2025:
Regional pricing strengthened, influenced by the increase in South Africa, a key supplier to several African and Gulf markets. Higher export offers from South Africa encouraged adjustments in procurement planning among buyers sourcing for construction, ceramics, and refractory applications. North African industries expanded their intake as project activity progressed, while Gulf manufacturers sustained steady offtake across industrial segments. Additional shipments from Germany and Brazil supported regional availability, though freight cost variability shaped landed pricing for East and West African markets. Varied infrastructure capacity and localized industrial momentum led to differing procurement intensities across subregions, contributing to a generally firmer tone.
Q2 2025:
Demand across MEA remained consistent, supported by construction, refractories, and chemical processing industries. Gulf producers continued to supply regional customers reliably, while North African markets reliant on imports handled steady arrival schedules with occasional port-related delays. Sub-Saharan buyers monitored currency developments to optimize purchasing decisions, leading to measured inventory management. Supply chains across key routes remained functional, allowing industrial users to source material predictably and maintain stable production operations.
Region-wise data and information on specific countries within these regions can also be provided.
| Region | Countries Covered |
|---|---|
| Middle East and Africa | Saudi Arabia, UAE, Israel, Iran, South Africa, Nigeria, Oman, Kuwait, Qatar, Iraq, Egypt, Algeria, and Morocco, among other Middle Eastern and African countries. |
Asia Pacific Aluminosilicate Price Trend
Q2 2026:
The aluminosilicate prices in Asia Pacific moved upward, reflecting increased manufacturing demand and supply constraints across the region. Germany experienced price increases due to heightened logistical inefficiencies and robust demand in both construction and ceramic applications. Buying activity remained strong as industries sought to capitalize on aluminosilicate's properties in high-temperature settings, leading to sustained procurement levels. Demand for aluminosilicate products was particularly notable in the refractory, glass, and foundry industries, ensuring a stable market for these materials. Manufacturers also maintained cautious offers because of elevated production and raw material costs.
Q1 2026:
Asia Pacific aluminosilicate prices showed a firmer tone during the first quarter. Japan posted a slight increase, supported by stable demand from ceramics, catalysts, specialty chemicals, and adsorbent uses. Buyers stayed cautious, yet regular procurement continued as manufacturers secured supply for scheduled production. Regional shipping costs and supply chain uncertainty supported delivered prices, especially for import dependent markets. China and South Korea supplied competitive material to regional buyers, but sellers resisted deep discounts when operating and logistics costs remained firm.
Q4 2025:
Across Asia Pacific, aluminosilicate prices reflected upward movement, supported by demand from ceramics manufacturing, refractories, and specialty industrial applications. Furthermore, steady downstream utilization encouraged regular procurement across the region. In addition, sourcing strategies emphasized inventory planning, cost management, and alignment with localized production schedules rather than opportunistic purchasing.
Q3 2025:
Regional prices moved higher, driven by stronger activity in Japan, where increased offtake from refractory and catalyst manufacturers supported higher import requirements. Several Southeast Asian markets, including Thailand, Vietnam, and Indonesia, managed procurement steadily as industrial programs advanced. Suppliers from Germany, Brazil, and South Africa continued to service the region, with logistics improvements at major ports helping to smooth inflows. Production adjustments by certain domestic manufacturers within the region supported balanced stock conditions. As downstream consumption remained consistent across multiple industrial segments, purchasing behavior reflected preparation for upcoming production cycles.
Q2 2025:
Demand in ceramics, construction materials, and catalyst applications remained stable across the region. Southeast Asian buyers managed procurement around vessel schedules to maintain continuity of supply, while domestic producers in various markets balanced output with routine industrial demand. Port operations generally performed well, allowing shipments to arrive in line with downstream requirements. Inventory management across the region remained structured, matching consistent manufacturing activity.
This aluminosilicate price analysis can be expanded to include a comprehensive list of countries within the region.
| Region | Countries Covered |
|---|---|
| Asia Pacific | China, India, Indonesia, Pakistan, Bangladesh, Japan, Philippines, Vietnam, Thailand, South Korea, Malaysia, Nepal, Taiwan, Sri Lanka, Hongkong, Singapore, Australia, and New Zealand, among other Asian countries. |
Latin America Aluminosilicate Price Trend
Q2 2026:
The aluminosilicate market in Latin America is primarily influenced by declining prices across the region, particularly with significant reductions in countries like Brazil. Political instability and inconsistent regulatory environments contributed to the fluctuations, impacting market confidence and pricing stability. Producers faced challenges in aligning supply with demand as economic conditions fluctuated. As a result, opportunities for growth in various end-user sectors, such as metallurgy and manufacturing, were moderated. The downward movement in aluminosilicate prices could affect investment in production capacity expansions.
Q1 2026:
Latin American aluminosilicate prices increased, led by firmer demand in Brazil. Downstream purchasing improved across coatings, construction products, detergents, ceramics, and water treatment applications. Import dependent supply chains remained sensitive to freight costs, currency movement, and delivery timing, which supported higher distributor offers. Buyers returned to regular procurement after a cautious previous quarter, and some stock rebuilding helped improve market sentiment. Domestic supply was available, but sellers held firm because replacement costs were higher and imported grades were less flexible in pricing.
Q4 2025:
The aluminosilicate market in Latin America experienced upward price movement, supported by demand from construction materials, ceramics, and industrial filler applications. Additionally, procurement activity aligned with steady downstream consumption and infrastructure-related project requirements. Moreover, sourcing decisions emphasized inventory management, logistics efficiency, and maintaining continuity of supply across regional markets.
Q3 2025:
Regional prices increased, driven notably by firmer conditions in Brazil, where demand from construction and ceramics producers intensified. These shifts contributed to more active procurement across neighboring countries as distributors worked to maintain supply coverage. Imports from South Africa and Germany offered additional sourcing options, though logistics planning required attention due to varying freight schedules and inland transport constraints in some markets. Buyers in countries such as Argentina and Chile aligned purchasing with currency considerations and local consumption rates. The quarter reflected a more assertive tone in procurement as regional industrial sectors progressed through higher-intensity production periods.
Q2 2025:
Markets across the region experienced steady demand from ceramics, construction, and metallurgical industries. Import flows through major ports remained consistent, supporting reliable supply lines for distributors. Currency movements played a role in procurement timing, while inland logistics conditions varied among countries. Buyers generally adopted prudent purchase planning aligned with regular industrial needs, maintaining a balanced demand environment throughout the quarter.
This comprehensive review can be extended to include specific countries within the region.
| Region | Countries Covered |
|---|---|
| Latin America | Brazil, Mexico, Argentina, Columbia, Chile, Ecuador, and Peru, among other Latin American countries.Brazil, Mexico, Argentina, Columbia, Chile, Ecuador, and Peru, among other Latin American countries. |
Aluminosilicate Pricing Report, Market Analysis, and News
IMARC's latest publication, “Aluminosilicate Prices, Trend, Chart, Demand, Market Analysis, News, Historical and Forecast Data Report 2026 Edition,” presents a detailed examination of the aluminosilicate market, providing insights into both global and regional trends that are shaping prices. This report delves into the spot price of aluminosilicate at major ports and analyzes the composition of prices, including FOB and CIF terms. It also presents detailed aluminosilicate price trend analysis by region, covering North America, Europe, Asia Pacific, Latin America, and Middle East and Africa. The factors affecting aluminosilicate pricing, such as the dynamics of supply and demand, geopolitical influences, and sector-specific developments, are thoroughly explored. This comprehensive report helps stakeholders stay informed with the latest market news, regulatory updates, and technological progress, facilitating informed strategic decision-making and forecasting.
Aluminosilicate Industry Analysis
The global aluminosilicate market size reached USD 223.4 Million in 2025. By 2034, IMARC Group expects the market to reach USD 303.9 Million, at a projected CAGR of 3.48% during 2026-2034. The market is primarily driven by rising demand for aluminosilicate in various industrial applications, such as ceramics, refractories, and construction materials, owing to its unique properties and versatility.
Latest News and Developments:
- October 2025: Malaysian researchers published a study demonstrating that using Tianqi aluminosilicate (TAS) as a partial replacement for Ordinary Portland Cement in foamed concrete improved mechanical strength, transport properties (like water absorption and permeability), and pore structure. The research highlights aluminosilicate’s potential in sustainable construction materials and eco-friendly building practices.
Product Description
Aluminosilicate is a mineral compound composed primarily of aluminum, silicon, and oxygen, known for its durability and heat-resistant properties. This material is a crucial component in the manufacturing of ceramics, refractories, and glass products due to its excellent thermal stability and resistance to thermal shock. Aluminosilicate is commonly used in high-temperature environments, such as in kilns, furnaces, and reactors, where it helps improve energy efficiency and performance. Its role as a binding agent in cement and concrete further extends its application in the construction industry. Additionally, its versatile properties make it suitable for specialized applications in the aerospace, defense, and automotive sectors, where high-performance materials are essential for safety and efficiency.
Report Coverage
| Key Attributes | Details |
|---|---|
| Product Name | Aluminosilicate |
| Report Features | Exploration of Historical Trends and Market Outlook, Industry Demand, Industry Supply, Gap Analysis, Challenges, Aluminosilicate Price Analysis, and Segment-Wise Assessment. |
| Currency/Units | US$ (Data can also be provided in local currency) or Metric Tons |
| Region/Countries Covered | The current coverage includes analysis at the global and regional levels only. Based on your requirements, we can also customize the report and provide specific information for the following countries: Asia Pacific: China, India, Indonesia, Pakistan, Bangladesh, Japan, Philippines, Vietnam, Thailand, South Korea, Malaysia, Nepal, Taiwan, Sri Lanka, Hongkong, Singapore, Australia, New Zealand Europe: Germany, France, United Kingdom, Italy, Spain, Russia, Turkey, Netherlands, Poland, Sweden, Belgium, Austria, Ireland, Switzerland, Norway, Denmark, Romania, Finland, Czech Republic, Portugal, Greece North America: United States, Canada Latin America: Brazil, Mexico, Argentina, Columbia, Chile, Ecuador, Peru Middle East & Africa: Saudi Arabia, UAE, Israel, Iran, South Africa, Nigeria, Oman, Kuwait, Qatar, Iraq, Egypt, Algeria, Morocco The list of countries presented is not exhaustive. Information on additional countries can be provided if required by the client. |
| Information Covered for Key Suppliers |
|
| Customization Scope | The report can be customized as per the requirements of the customer |
| Report Price and Purchase Option |
Plan A: Monthly Updates - Annual Subscription
Plan B: Quarterly Updates - Annual Subscription
Plan C: Biannually Updates - Annual Subscription
|
| Post-Sale Analyst Support | 360-degree analyst support after report delivery |
| Delivery Format | PDF and Excel through email (We can also provide the editable version of the report in PPT/Word format on special request) |
Key Benefits for Stakeholders:
- IMARC’s report presents a detailed analysis of aluminosilicate pricing, covering global and regional trends, spot prices at key ports, and a breakdown of FOB and CIF prices.
- The study examines factors affecting aluminosilicate price trend, including input costs, supply-demand shifts, and geopolitical impacts, offering insights for informed decision-making.
- The competitive landscape review equips stakeholders with crucial insights into the latest market news, regulatory changes, and technological advancements, ensuring a well-rounded, strategic overview for forecasting and planning.
- IMARC offers various subscription options, including monthly, quarterly, and biannual updates, allowing clients to stay informed with the latest market trends, ongoing developments, and comprehensive market insights. The aluminosilicate price charts ensure our clients remain at the forefront of the industry.
Need more help?
- Speak to our experienced analysts for insights on the current market scenarios.
- Include additional segments and countries to customize the report as per your requirement.
- Gain an unparalleled competitive advantage in your domain by understanding how to utilize the report and positively impacting your operations and revenue.
- For further assistance, please connect with our analysts.
 Request Customization
 Inquire Before Buying
 Speak to an Analyst
 Request Brochure
Benefits of Customization
- Personalize this research
- Triangulate with your data
- Get data as per your format and definition
- Gain a deeper dive into a specific application, geography, customer, or competitor
- Any level of personalization
Get in Touch With Us
UNITED STATES
Phone: +1-201-971-6302
INDIA
Phone: +91-120-433-0800
UNITED KINGDOM
Phone: +44-753-714-6104
Email: [email protected]
Client Testimonials




.webp)




.webp)













Related Reports

Why Choose Us
IMARC offers trustworthy, data-centric insights into commodity pricing and evolving market trends, enabling businesses to make well-informed decisions in areas such as procurement, strategic planning, and investments. With in-depth knowledge spanning more than 1000 commodities and a vast global presence in over 150 countries, we provide tailored, actionable intelligence designed to meet the specific needs of diverse industries and markets.
1000
+Commodities
150
+Countries Covered
3000
+Clients
20
+Industry

Robust Methodologies & Extensive Resources
IMARC delivers precise commodity pricing insights using proven methodologies and a wealth of data to support strategic decision-making.

Subscription-Based Databases
Our extensive databases provide detailed commodity pricing, import-export trade statistics, and shipment-level tracking for comprehensive market analysis.

Primary Research-Driven Insights
Through direct supplier surveys and expert interviews, we gather real-time market data to enhance pricing accuracy and trend forecasting.

Extensive Secondary Research
We analyze industry reports, trade publications, and market studies to offer tailored intelligence and actionable commodity market insights.
Trusted by 3000+ industry leaders worldwide to drive data-backed decisions. From global manufacturers to government agencies, our clients rely on us for accurate pricing, deep market intelligence, and forward-looking insights.