
Australia Wind Energy Market Report by Component (Turbine, Support Structure, Electrical Infrastructure, Others), Rating (≤ 2 MW, >2 ≤ 5 MW, >5 ≤ 8 MW, >8 ≤ 10 MW, >10 ≤ 12 MW, >12 MW), Installation (Offshore, Onshore), Turbine Type (Horizontal Axis, Vertical Axis), Application (Utility, Industrial, Commercial, Residential), and Region 2025-2033
Australia Wind Energy Market Size and Share:
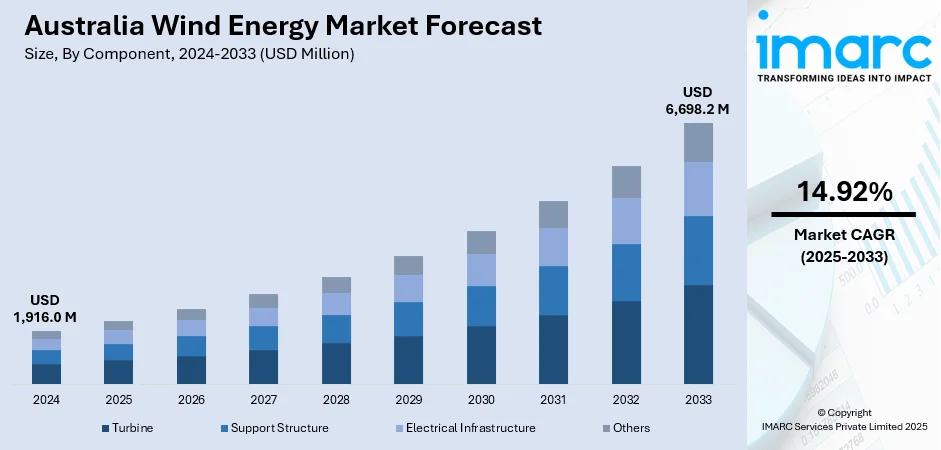
The Australia wind energy market size reached USD 1,916.0 Million in 2024. Looking forward, the market is expected to reach USD 6,698.2 Million by 2033, exhibiting a growth rate (CAGR) of 14.92% during 2025-2033. The market is rapidly expanding due to the implementation of favorable government policies, continual technological innovations, increasing public and corporate demand for sustainable solutions, global market trends and investment flows, rural development and community support, corporate sustainability goals.
|
Report Attribute
|
Key Statistics
|
|---|---|
|
Base Year
|
2024
|
|
Forecast Years
|
2025-2033
|
|
Historical Years
|
2019-2024
|
|
Market Size in 2024
|
USD 1,916.0 Million |
|
Market Forecast in 2033
|
USD 6,698.2 Million |
| Market Growth Rate 2025-2033 | 14.92% |
Key Trends of Australia Wind Energy Market:
Government policies and incentives
Australia's wind energy market is significantly driven by favorable government policies and incentives. Federal and state governments have established a range of measures to support the growth of renewable energy. The renewable energy target (RET) is a pivotal policy, setting ambitious goals for the proportion of electricity generated from renewable sources. Additionally, various state governments have introduced their own renewable energy targets and incentives, such as feed-in tariffs and renewable energy certificates, to encourage investment in wind energy. These policies create a stable regulatory environment, reduce financial risks for investors, and stimulate technological advancements. By providing subsidies and tax incentives, the government lowers the cost of wind energy projects, making them more competitive compared to traditional fossil fuels. This regulatory support boosts investor confidence as well as drives innovation and expansion within the industry.
To get more information on this market, Request Sample
Continual technological advancements
Innovations in wind turbine design and technology have significantly increased the efficiency and viability of wind power. Modern wind turbines are larger, more efficient, and capable of generating more electricity at lower wind speeds. Developments in turbine materials, such as lightweight composites, and improvements in aerodynamic design have enhanced performance and reduced maintenance costs. Additionally, ongoing advancements in digital technology and data analytics have optimized wind farm operations and energy production. These technological improvements have led to a reduction in the cost of wind energy, making it increasingly competitive with traditional energy sources. Furthermore, advancements in energy storage technologies, such as batteries, have addressed the intermittency of wind power, enabling more reliable and consistent energy supply. As technology continues to develop, the efficiency and cost-effectiveness of wind energy are expected to improve further, driving continued investment and growth in the Australian wind energy market.
Corporate sustainability goals
Corporate sustainability goals have become an influential driver of the wind energy market in Australia. Several Australian companies are setting ambitious targets to reduce their carbon footprint and transition to renewable energy sources as part of their corporate social responsibility (CSR) initiatives. Companies across various sectors, including mining, manufacturing, and retail, are increasingly committing to power their operations with renewable energy to meet their sustainability objectives and enhance their environmental credentials. This corporate demand for green energy has led to an increase in corporate power purchase agreements (PPAs) with wind farms. These agreements provide long-term, stable revenue streams for wind projects, making them more financially viable. As more businesses prioritize sustainability and seek to achieve net-zero emissions, their investment in wind energy supports their goals and drives the expansion of the sector.
Growth Drivers of Australia Wind Energy Market:
Expanding Renewable Energy Zones (REZs)
The creation of Renewable Energy Zones (REZs) in such states as Victoria, Queensland, and New South Wales, is a key driver for wind energy development in Australia. These are strategically placed areas of high renewable resource potential with government planning behind them, simplified permitting, and coordinated grid infrastructure investment. By facilitating investment in certain areas, REZs minimize development risk and expense and give certainty to wind project developers. They also enhance grid efficiency by guaranteeing that there is transmission capacity where new generation is constructed. REZs also bring together stakeholders, governments, communities, and industry in collaboration, providing a platform for mass deployment. As more REZs are implemented, they are expected to continue unlocking high-quality wind sites and support Australia’s long-term clean energy transition, further fueling the Australia wind energy market growth.
Declining Cost of Wind Energy Production
The price of wind power has fallen considerably in the last decade, led by innovation, economies of scale, and increased efficiency. New wind turbines have bigger rotor diameters, taller heights, and more advanced blade design, driving more power at lower wind speeds. These advancements have resulted in a substantial drop in the levelized cost of energy (LCOE), which has rendered wind more competitive with fossil fuels and even solar power in some locations. Moreover, enhanced predictive analytics, remote monitoring, and digital controls have enhanced maintenance practices and operational reliability, further reducing long-term costs. This increased cost competitiveness not only brings investment but also puts wind at the center of Australia's energy future, especially as carbon-emitting power sources are gradually phased out.
Rising Energy Demand from Electrification
Australia’s energy consumption landscape is evolving rapidly as the country shifts toward electrification across multiple sectors. The transition to electric vehicles, electric heating, and electrified industrial processes is significantly increasing overall electricity demand. This surge is creating a greater need for reliable, large-scale renewable energy sources—and wind power is uniquely positioned to meet that demand. Wind farms can generate electricity at scale, often during periods when solar output is low, contributing to a more balanced and resilient grid. Additionally, electrification aligns with national and state-level climate targets, further driving policy and market support for renewables. As demand for clean electricity grows, wind energy will play a central role in delivering affordable, low-emission power to support Australia's sustainable economic development.
Government Support of Australia Wind Energy Market:
Clean Energy Finance Corporation (CEFC) Investments
The Clean Energy Finance Corporation (CEFC) plays a crucial role in accelerating Australia’s wind energy transition by offering long-term, low-cost capital to eligible projects. By financing large-scale wind farms and supporting related infrastructure such as grid connections and storage systems, the CEFC helps reduce financial barriers for developers and mitigates risks that would otherwise deter private sector investment. The corporation actively co-invests alongside commercial lenders, de-risking renewable ventures while promoting innovation and emissions reduction. Its involvement enhances investor confidence, particularly in early-stage or complex projects, where private funding might be scarce. The CEFC also supports technology integration and modernization efforts within the wind sector, contributing to the development of a more resilient, cost-effective, and low-carbon energy grid across Australia.
Capacity Investment Scheme (CIS)
Australia’s Capacity Investment Scheme (CIS) is a federal initiative designed to bolster investor confidence in renewable energy projects, including wind power, which is one of the key factors influencing the Australia wind energy market demand. The scheme provides long-term revenue certainty by underwriting a portion of project income, helping renewable energy developers manage fluctuating electricity prices. This guaranteed revenue stream reduces financial risk, particularly in a volatile energy market, and makes wind projects more attractive to institutional and private investors. The CIS also encourages the co-development of firming technologies, such as battery storage, which ensures grid stability alongside intermittent wind generation. By enabling a more reliable return on investment, the scheme is expected to accelerate large-scale wind deployment and support Australia’s transition to a decarbonized electricity system, while also contributing to national energy security goals.
State-Level Auctions and Contracts
State governments in Australia, notably Victoria, Queensland, and New South Wales, are implementing reverse auctions and long-term contract schemes to incentivize wind energy development. These auctions invite project developers to bid for power purchase agreements (PPAs), with successful bidders securing price guarantees over extended periods. This reduces exposure to wholesale market volatility and enhances project bankability. Such competitive procurement models drive down electricity costs by encouraging innovation and efficiency among developers. In addition, state-led contracts often prioritize projects that contribute to job creation, regional development, and grid stability. These programs not only accelerate renewable energy deployment but also align with state-specific emissions reduction targets. The result is a more predictable policy environment, giving wind energy stakeholders greater confidence in future growth and returns.
Opportunities of Australia Wind Energy Market:
Offshore and Floating Wind Development
Australia's extensive coastline and abundant wind resources offer major opportunities for offshore and floating wind development, particularly in regions like Victoria, Tasmania, and South Australia. These areas are close to population and industrial hubs, allowing efficient delivery of electricity to high-demand zones. Offshore wind projects also face fewer land-use conflicts and can host large-capacity turbines, enhancing generation potential. Floating wind technology, though still emerging, enables deployment in deeper waters where wind speeds are typically stronger and more consistent. With supportive regulatory frameworks under development and growing investor interest, offshore wind is poised to play a vital role in Australia’s future energy mix. These projects can complement onshore wind and solar generation, increase grid reliability, and support decarbonization goals across various sectors of the economy.
Integration with Green Hydrogen Projects
The synergy between wind energy and green hydrogen production represents a transformative opportunity for Australia’s clean energy future, which is fueling the Australia wind energy market share. Wind farms generate clean electricity that can be used to operate electrolysers, which separate water into hydrogen and oxygen through a carbon-free process. This method enables the production of hydrogen fuel without greenhouse gas emissions, making it a key component in the transition to sustainable energy systems. This green hydrogen can then be used as a clean fuel alternative in hard-to-decarbonize sectors such as steelmaking, heavy transport, and industrial heating. It also offers strong export potential to energy-hungry countries like Japan and South Korea, where demand for clean hydrogen is rapidly growing. Australia’s vast land, wind resources, and established trade links give it a strategic advantage in becoming a global hydrogen exporter. Integrating wind energy with hydrogen projects can also improve grid flexibility and ensure better utilization of intermittent power.
Expansion into Remote and Mining Regions
Wind energy presents a promising solution for powering remote and mining regions in Australia, which have traditionally relied on diesel generators and other high-emission fuels. By deploying wind turbines, often in hybrid systems with solar and storage, these off-grid areas can reduce fuel costs, lower emissions, and enhance energy security. Mining operations, in particular, face increasing pressure to decarbonize due to ESG (Environmental, Social, and Governance) requirements from global markets and investors. Wind energy offers a clean, scalable alternative that aligns with sustainability goals while ensuring operational continuity. Additionally, local wind projects can create regional jobs, improve community resilience, and reduce the logistical complexity of transporting fossil fuels to isolated locations. This expansion also supports Australia’s broader net-zero ambitions.
Challenges of Australia Wind Energy Market:
Grid Transmission Constraints
One of the most pressing challenges facing Australia’s wind energy sector is the limited capacity of existing grid infrastructure in wind-rich regions. Areas with the strongest wind potential—such as parts of South Australia, Tasmania, and regional New South Wales—often lack sufficient transmission lines to transport electricity to major demand centers. This bottleneck leads to curtailment, where generated wind power cannot be used, resulting in revenue loss and reduced project efficiency. Developers may be forced to invest in costly grid upgrades or face delays in connecting new projects. The complexity and high cost of building new transmission corridors further compound the issue. Addressing these constraints is critical to unlocking the full potential of wind energy and ensuring stable integration into Australia’s broader electricity system.
Community Opposition and Land Use Conflicts
Despite the environmental benefits of wind energy, projects frequently face resistance from local communities and landowners. Concerns typically revolve around visual intrusion, noise from turbines, shadow flicker, and potential impacts on local wildlife or property values. In rural or scenic areas, such objections can lead to strong opposition, protests, or legal action, complicating project timelines and increasing uncertainty for investors. In some cases, perceived lack of consultation or equitable benefit-sharing intensifies resistance. According to the Australia wind energy market analysis, these conflicts can stall or even derail planned developments, especially when local councils or advocacy groups become involved. To overcome this challenge, developers must prioritize transparent engagement, address community concerns early, and consider co-benefit strategies such as local job creation or shared ownership models that align wind energy with regional interests.
Long Approval and Permitting Timelines
Lengthy and complex permitting processes pose a significant challenge to the timely deployment of wind energy projects in Australia. Developers must navigate multiple layers of environmental assessments, planning permits, and regulatory approvals, often across federal, state, and local government levels. These procedures, while necessary to ensure environmental and social responsibility, can take several years to complete. Delays may arise from staffing shortages at regulatory bodies, procedural inconsistencies, or legal appeals by opposing stakeholders. Extended timelines increase project costs, deter investment, and slow progress toward renewable energy targets. Streamlining regulatory processes, improving coordination between agencies, and setting clearer timelines could significantly accelerate wind project deployment without compromising environmental or community standards.
Australia Wind Energy Market Segmentation:
IMARC Group provides an analysis of the key trends in each segment of the market, along with forecasts at the country level for 2025-2033. Our report has categorized the market based on component, rating, installation, turbine type, and application.
Component Insights:
- Turbine
- Support Structure
- Electrical Infrastructure
- Others
The report has provided a detailed breakup and analysis of the market based on the component. This includes turbine, support structure, electrical infrastructure, and others.
Rating Insights:
- ≤ 2 MW
- >2 ≤ 5 MW
- >5 ≤ 8 MW
- >8 ≤ 10 MW
- >10 ≤ 12 MW
- >12 MW
A detailed breakup and analysis of the market based on the rating have also been provided in the report. This includes ≤ 2 MW, >2 ≤ 5 MW, >5 ≤ 8 MW, >8 ≤ 10 MW, >10 ≤ 12 MW, and >12 MW.
Installation Insights:
- Offshore
- Onshore
The report has provided a detailed breakup and analysis of the market based on the installation. This includes offshore and onshore.
Turbine Type Insights:
- Horizontal Axis
- Vertical Axis
A detailed breakup and analysis of the market based on the turbine type have also been provided in the report. This includes horizontal axis and vertical axis.
Application Insights:
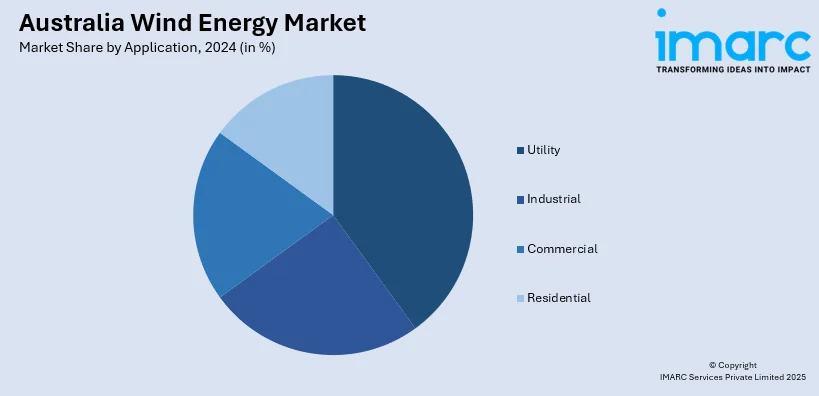
- Utility
- Industrial
- Commercial
- Residential
The report has provided a detailed breakup and analysis of the market based on the application. This includes utility, industrial, commercial, and residential.
Regional Insights:
- Australia Capital Territory & New South Wales
- Victoria & Tasmania
- Queensland
- Northern Territory & Southern Australia
- Western Australia
The report has also provided a comprehensive analysis of all the major regional markets, which include Australia Capital Territory & New South Wales, Victoria & Tasmania, Queensland, Northern Territory & Southern Australia, and Western Australia.
Competitive Landscape:
The market research report has also provided a comprehensive analysis of the competitive landscape. Competitive analysis such as market structure, key player positioning, top winning strategies, competitive dashboard, and company evaluation quadrant has been covered in the report. Also, detailed profiles of all major companies have been provided.
Australia Wind Energy Market News:
- On 17th July 2024, Australia’s Ministry for Climate Change and Energy has approved twelve offshore wind projects that have received feasibility licenses for the Gippsland Offshore Wind Zone, with the potential to generate up to 25 GW. This initiative includes RWE's Kent Offshore Wind Farm and BlueFloat's Gippsland Dawn project, both aiming to generate over 2 GW each. These projects are part of Australia’s growing offshore wind sector, aiming to power millions of homes and create thousands of jobs by the early 2030s.
Australia Wind Energy Market Report Coverage:
| Report Features | Details |
|---|---|
| Base Year of the Analysis | 2024 |
| Historical Period | 2019-2024 |
| Forecast Period | 2025-2033 |
| Units | Million USD |
| Scope of the Report | Exploration of Historical Trends and Market Outlook, Industry Catalysts and Challenges, Segment-Wise Historical and Future Market Assessment:
|
| Components Covered | Turbine, Support Structure, Electrical Infrastructure, Others |
| Ratings Covered | ≤ 2 MW, >2 ≤ 5 MW, >5 ≤ 8 MW, >8 ≤ 10 MW, >10 ≤ 12 MW, >12 MW |
| Installations Covered | Offshore, Onshore |
| Turbine Types Covered | Horizontal Axis, Vertical Axis |
| Applications Covered | Utility, Industrial, Commercial, Residential |
| Regions Covered | Australia Capital Territory & New South Wales, Victoria & Tasmania, Queensland, Northern Territory & Southern Australia, Western Australia |
| Customization Scope | 10% Free Customization |
| Post-Sale Analyst Support | 10-12 Weeks |
| Delivery Format | PDF and Excel through Email (We can also provide the editable version of the report in PPT/Word format on special request) |
Key Benefits for Stakeholders:
- IMARC’s industry report offers a comprehensive quantitative analysis of various market segments, historical and current market trends, market forecasts, and dynamics of the Australia wind energy market from 2019-2033.
- The research report provides the latest information on the market drivers, challenges, and opportunities in the Australia wind energy market.
- Porter's five forces analysis assist stakeholders in assessing the impact of new entrants, competitive rivalry, supplier power, buyer power, and the threat of substitution. It helps stakeholders to analyze the level of competition within the Australia wind energy industry and its attractiveness.
- Competitive landscape allows stakeholders to understand their competitive environment and provides an insight into the current positions of key players in the market.
Key Questions Answered in This Report
The wind energy market in Australia was valued at USD 1,916.0 Million in 2024.
The Australia wind energy market is projected to exhibit a CAGR of 14.92% during 2025-2033.
The Australia wind energy market is projected to reach a value of USD 6,698.2 Million by 2033.
Key trends in Australia’s wind energy market include rapid expansion of onshore wind farms, growing investments in offshore and floating wind technologies, and increasing integration with battery storage systems. Policy support and grid upgrades are accelerating development, though regulatory uncertainty and project approval delays continue to pose notable challenges.
The Australia wind energy market is driven by ambitious renewable energy targets, federal and state-level funding initiatives, and falling technology costs. The development of Renewable Energy Zones (REZs), improved transmission infrastructure, and strong corporate demand for clean energy through long-term power purchase agreements (PPAs) further accelerate market expansion.
Need more help?
- Speak to our experienced analysts for insights on the current market scenarios.
- Include additional segments and countries to customize the report as per your requirement.
- Gain an unparalleled competitive advantage in your domain by understanding how to utilize the report and positively impacting your operations and revenue.
- For further assistance, please connect with our analysts.
 Request Customization
 Speak to an Analyst
 Request Brochure
 Inquire Before Buying
Benefits of Customization
- Personalize this research
- Triangulate with your data
- Get data as per your format and definition
- Gain a deeper dive into a specific application, geography, customer, or competitor
- Any level of personalization
Get in Touch With Us
UNITED STATES
Phone: +1-201-971-6302
INDIA
Phone: +91-120-433-0800
UNITED KINGDOM
Phone: +44-753-714-6104
Email: sales@imarcgroup.com
Client Testimonials


.webp)


